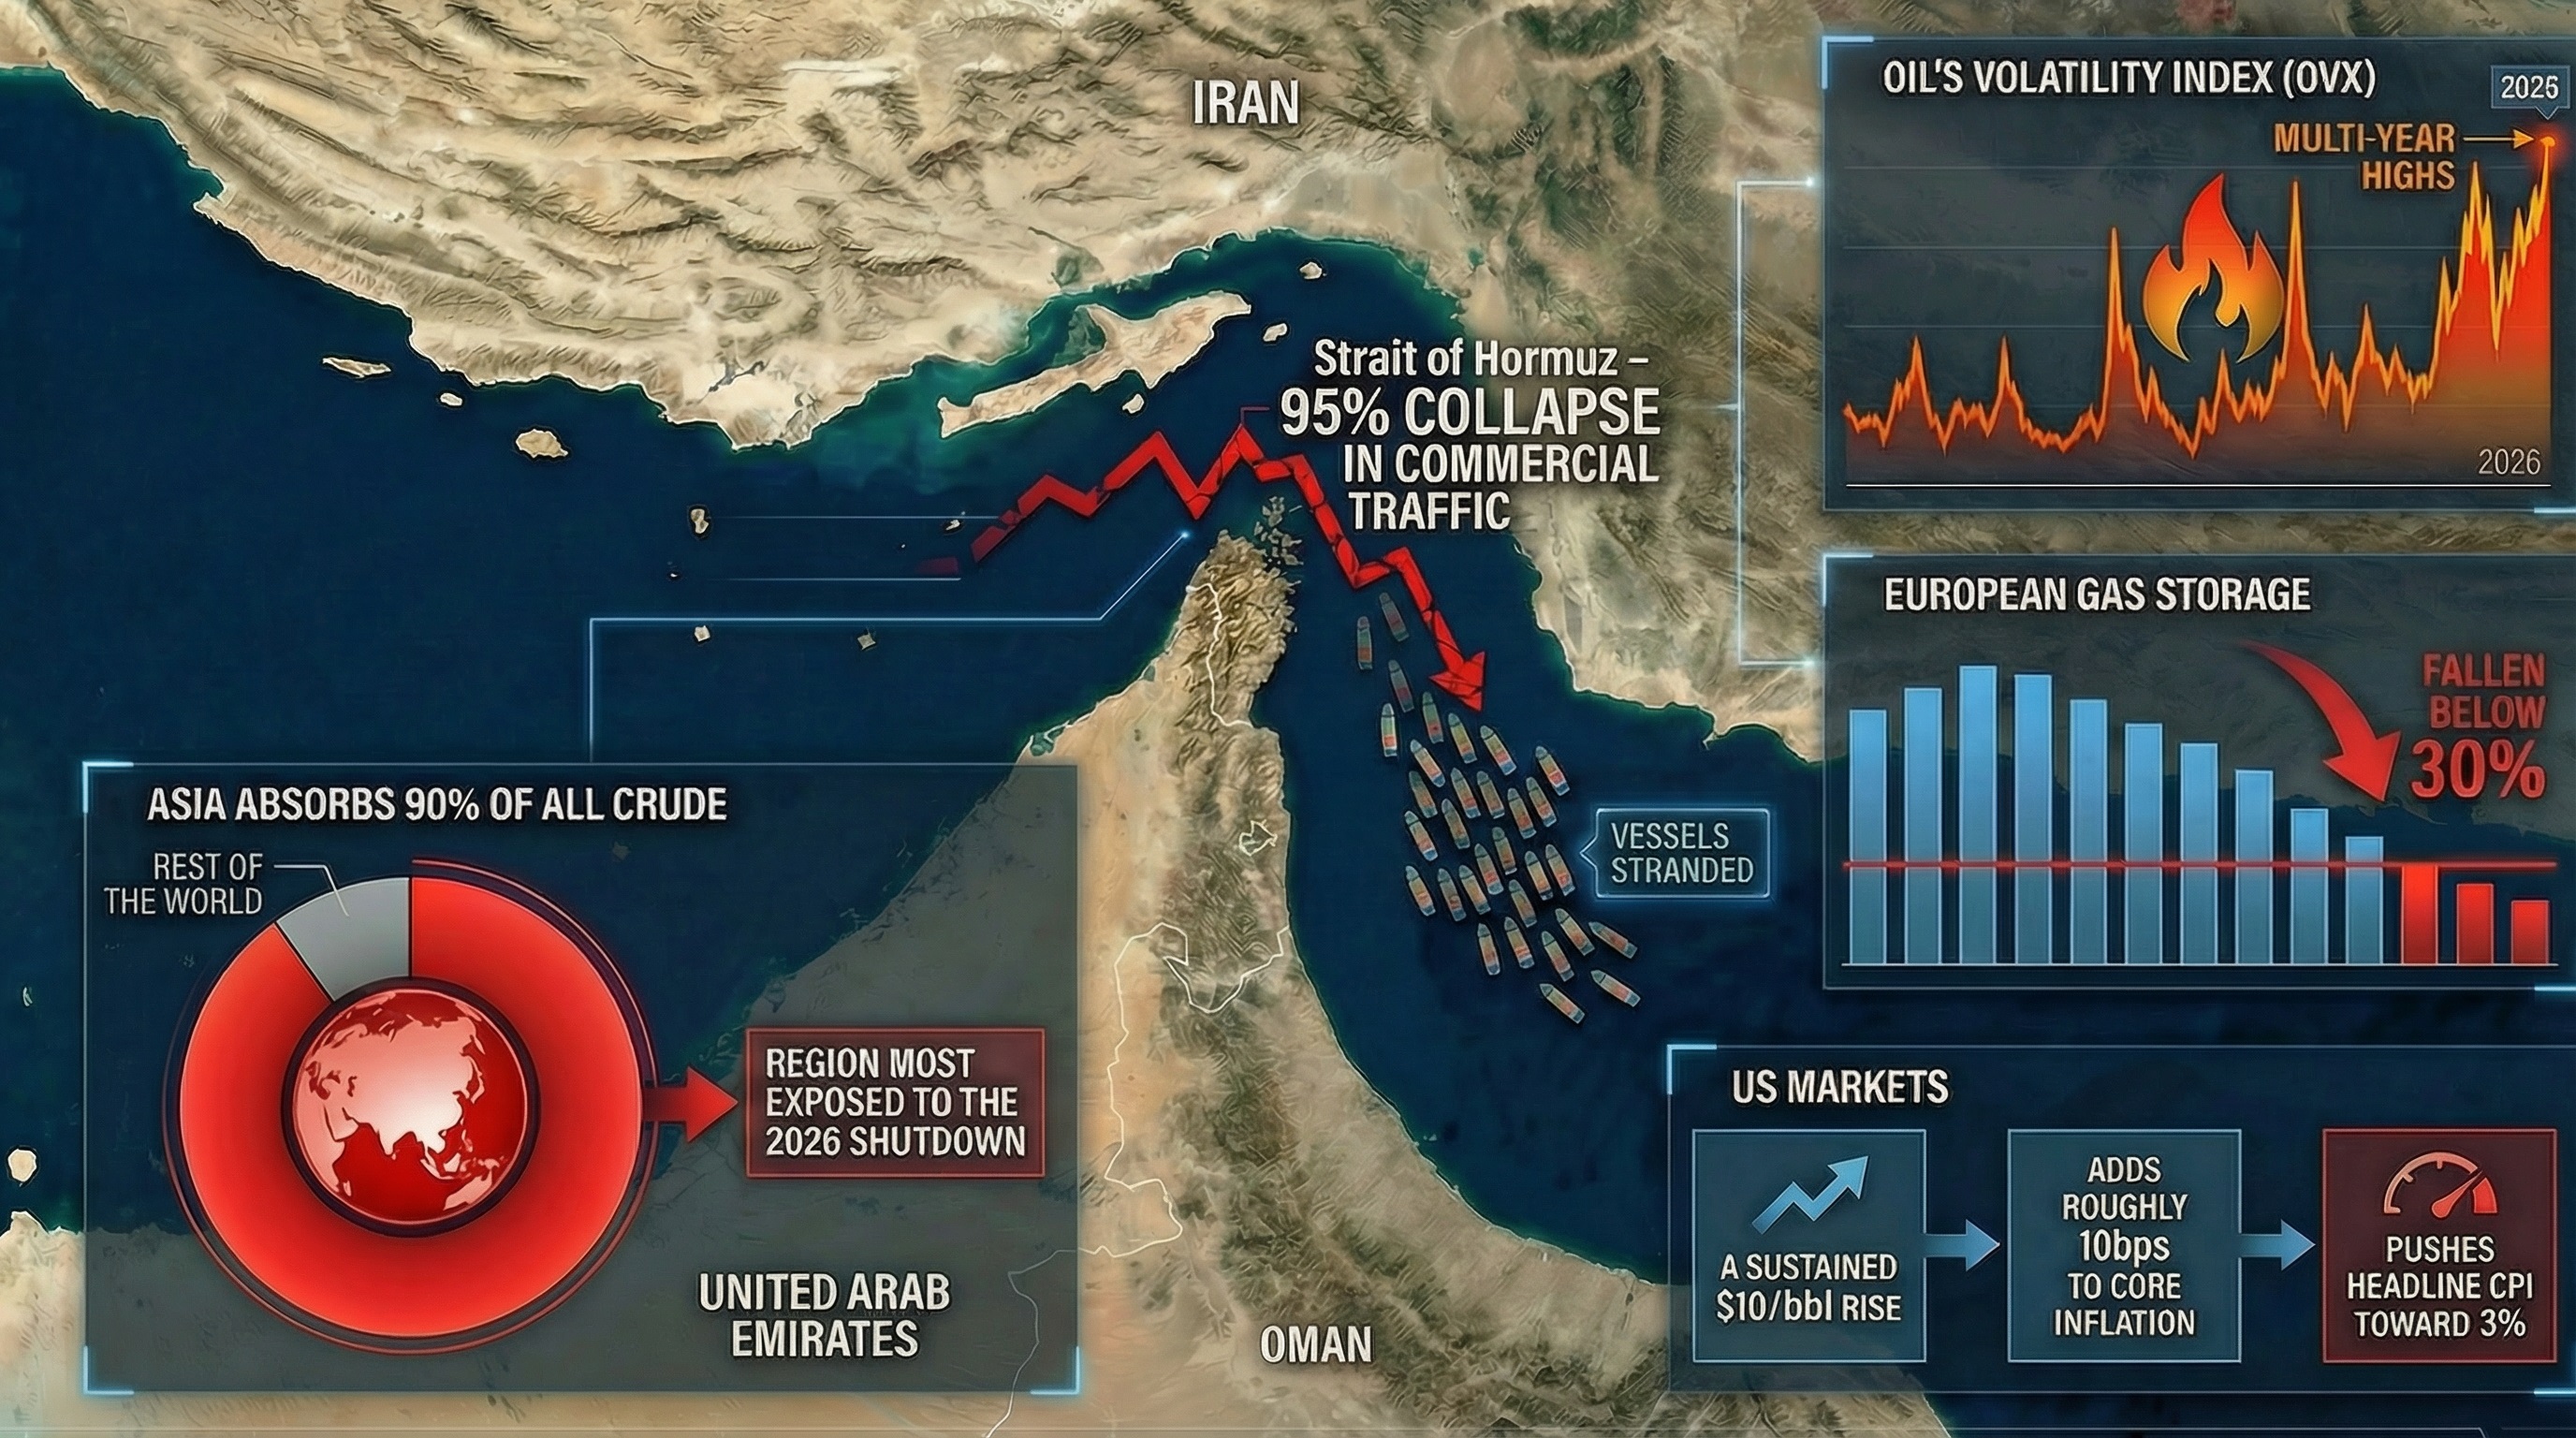
The 2026 Iran conflict has tightened global energy supply chains and reset pricing across oil, LNG, shipping, and other inflation-sensitive assets. Iran’s leverage comes from geography rather than domestic strength. Its position at the Strait of Hormuz is now decisive: Iran and the IRGC have made the waterway functionally impassable through kinetic threats and signal disruption, driving a 95% collapse in commercial traffic and leaving vessels stranded.
As the blockade deepens, upstream supply is being forced offline—most notably Iraq’s southern fields, now constrained by full storage and halted exports. Price volatility has accelerated, with Brent surging near $120/bbl before retreating on shifting geopolitical signals. LNG markets are under force majeure, and global logistics networks are absorbing multi-week detours.
Against this backdrop, investors face new pricing pressures and risk premia across commodities, rates, credit, and FX. This report examines the transmission channels most relevant for capital protection and strategic positioning in this environment.
If this disruption is altering your portfolio’s risk profile, we can help you assess the impact. Connect with our experts for the most effective defensive and tactical measures in the current environment.
Iran’s Domestic Economy: Structural Fragility with Systemic External Effects
Iran’s economic footprint is modest, but its internal vulnerabilities now play a decisive role in shaping its geopolitical behaviour and, by extension, global supply risk.
Key structural characteristics include:
- GDP contraction is now expected to exceed –10% in 2026, reflecting infrastructure damage, sanctions snapback, and the collapse of trade routes.
- Inflation is approaching 50%, driven by currency depreciation and severe supply-chain disruption.
- Labour-market under-utilisation remains extreme, with only 38% employed and female participation near 12%, now worsened by conflict-related shutdowns.
- Poverty rates are rising toward ~39%, deepening social instability.
- Banking insolvency is widespread; with sanctions tightening, the system is relying on an expanded barter-for-imports mechanism to secure food and essentials.
These conditions leave Iran with minimal policy flexibility and heighten the appeal of external tools—energy disruption, proxy escalation, and sanctions-evasion channels—as instruments of leverage.
For investors, the significance lies not in Iran’s domestic macro fundamentals but in the behaviours they incentivise, which directly influence oil supply, LNG flows, and global commodity pricing.
Iran Conflict 2026: The Strategic Role of the Strait of Hormuz
The Strait of Hormuz typically carries ~25% of global seaborne crude and ~20% of global LNG, making it the world’s most concentrated energy corridor. Its effective closure in 2026 has moved the system from vulnerability to active supply-chain rupture, with commercial transit down roughly 95%.
Any constraint on throughput now feeds directly into spot and futures pricing, inflation expectations, and rate assumptions.
Crude Flow Dynamics
Saudi Arabia, Iraq, the UAE, Kuwait, Qatar, and Iran depend on this route, with Asia absorbing around 90% of crude flows.
Key destinations include:
- China
- India
- South Korea
- Japan
These importers have limited short-run substitution options. Even a 10–15% disruption can materially reprice Brent and WTI, steepen backwardation, and trigger volatility-targeting flows that amplify price movements.
LNG Exposure
LNG passing through Hormuz remains critical for Europe, South Asia, and East Asia, though sensitivity varies:
- Europe is partially insulated post-2022 but remains exposed when storage levels are low.
- South and East Asia face immediate cost pass-through, affecting trade balances and domestic inflation.
Disruptions influence TTF, JKM, and cross-regional spreads, with knock-on effects for electricity pricing and industrial output.
Oil Market Sensitivity: Supply, Price Elasticity, and Geopolitical Premiums
Iran holds the world’s third-largest crude reserves and a major gas base. While sanctions limit official exports, its ability to add or withdraw barrels remains a critical variable for global price stability.
Supply Characteristics
Iranian crude is low-cost, and the state can operate at breakevens below many OPEC peers. Sanctions push most volumes into discounted channels—over 90% now flow to China, which sources about 11% of its total imports from Iran and is therefore exposed to any disruption at Iranian loading terminals.
Price Elasticity
Oil demand is highly inelastic in the short run, making disruptions unusually potent.The March 2026 conflict demonstrated this clearly: Brent briefly surged to $119.50/bbl before retreating on shifting geopolitical signals.
The effective closure of Hormuz and regional force majeure declarations create a geopolitical premium that can expand rapidly, often reaching $25–$50 in periods of active strikes.
Key drivers of premium expansion include:
- Rising shipping and insurance risk
- War-risk premiums widening
- Proxy threats to regional infrastructure
- Anticipated supply retaliation
Volatility Dynamics
Oil’s volatility index (OVX) has spiked to multi-year highs, reflecting oil’s role as the immediate transmission channel for inflation risk. Gold volatility (GVZ), by contrast, has been more subdued, as gold is influenced by real rates and occasional liquidity-driven selling.
Investor Relevance
Oil now functions simultaneously as:
- A risk asset, responding to geopolitical shocks; and
- An inflation-transmission asset, shaping bond yields, EM FX, and central-bank reaction functions.
Understanding this dual role is central to portfolio construction in the current environment.
European Exposure: Growth Sensitivity and Gas Risk Transmission
Europe’s energy diversification since 2022—toward Norway, the US, and North Africa, and supported by expanded LNG regasification capacity—has reduced structural reliance on Russia and the Middle East. But the March 2026 disruption has exposed the limits of that resilience.
Storage and Price Pressure
European gas storage has fallen to below 30%, creating a tight supply backdrop heading into the summer refill season.TTF prices have reacted sharply: the benchmark surged toward €70/MWh, reflecting concerns that a sustained Hormuz closure could push levels toward the €100/MWh range.
Macro Sensitivity
Europe remains highly growth-sensitive to energy shocks. Rising gas and electricity costs are already pressuring margins in energy-intensive sectors.** **By contrast, the US is more inflation-sensitive, given the higher fuel weighting in CPI.
Policy Divergence
The ECB has shifted into a hawkish pause, delaying rate cuts as energy-led inflation risks re-emerge. The Fed, meanwhile, faces more direct inflation pass-through from oil, increasing the likelihood of a slower easing path.
US Markets: Inflation Transmission and Monetary Implications
The US retains structural energy resilience due to consolidated shale output (majors holding breakevens in the $30–$40 range). But with Brent now above $114/bbl amid the Iran conflict, the inflation channel has reactivated.
Higher oil feeds directly into:
- Headline CPI
- Inflation expectations
- Transportation and freight costs
- Consumer sentiment
- Margins for energy-intensive sectors
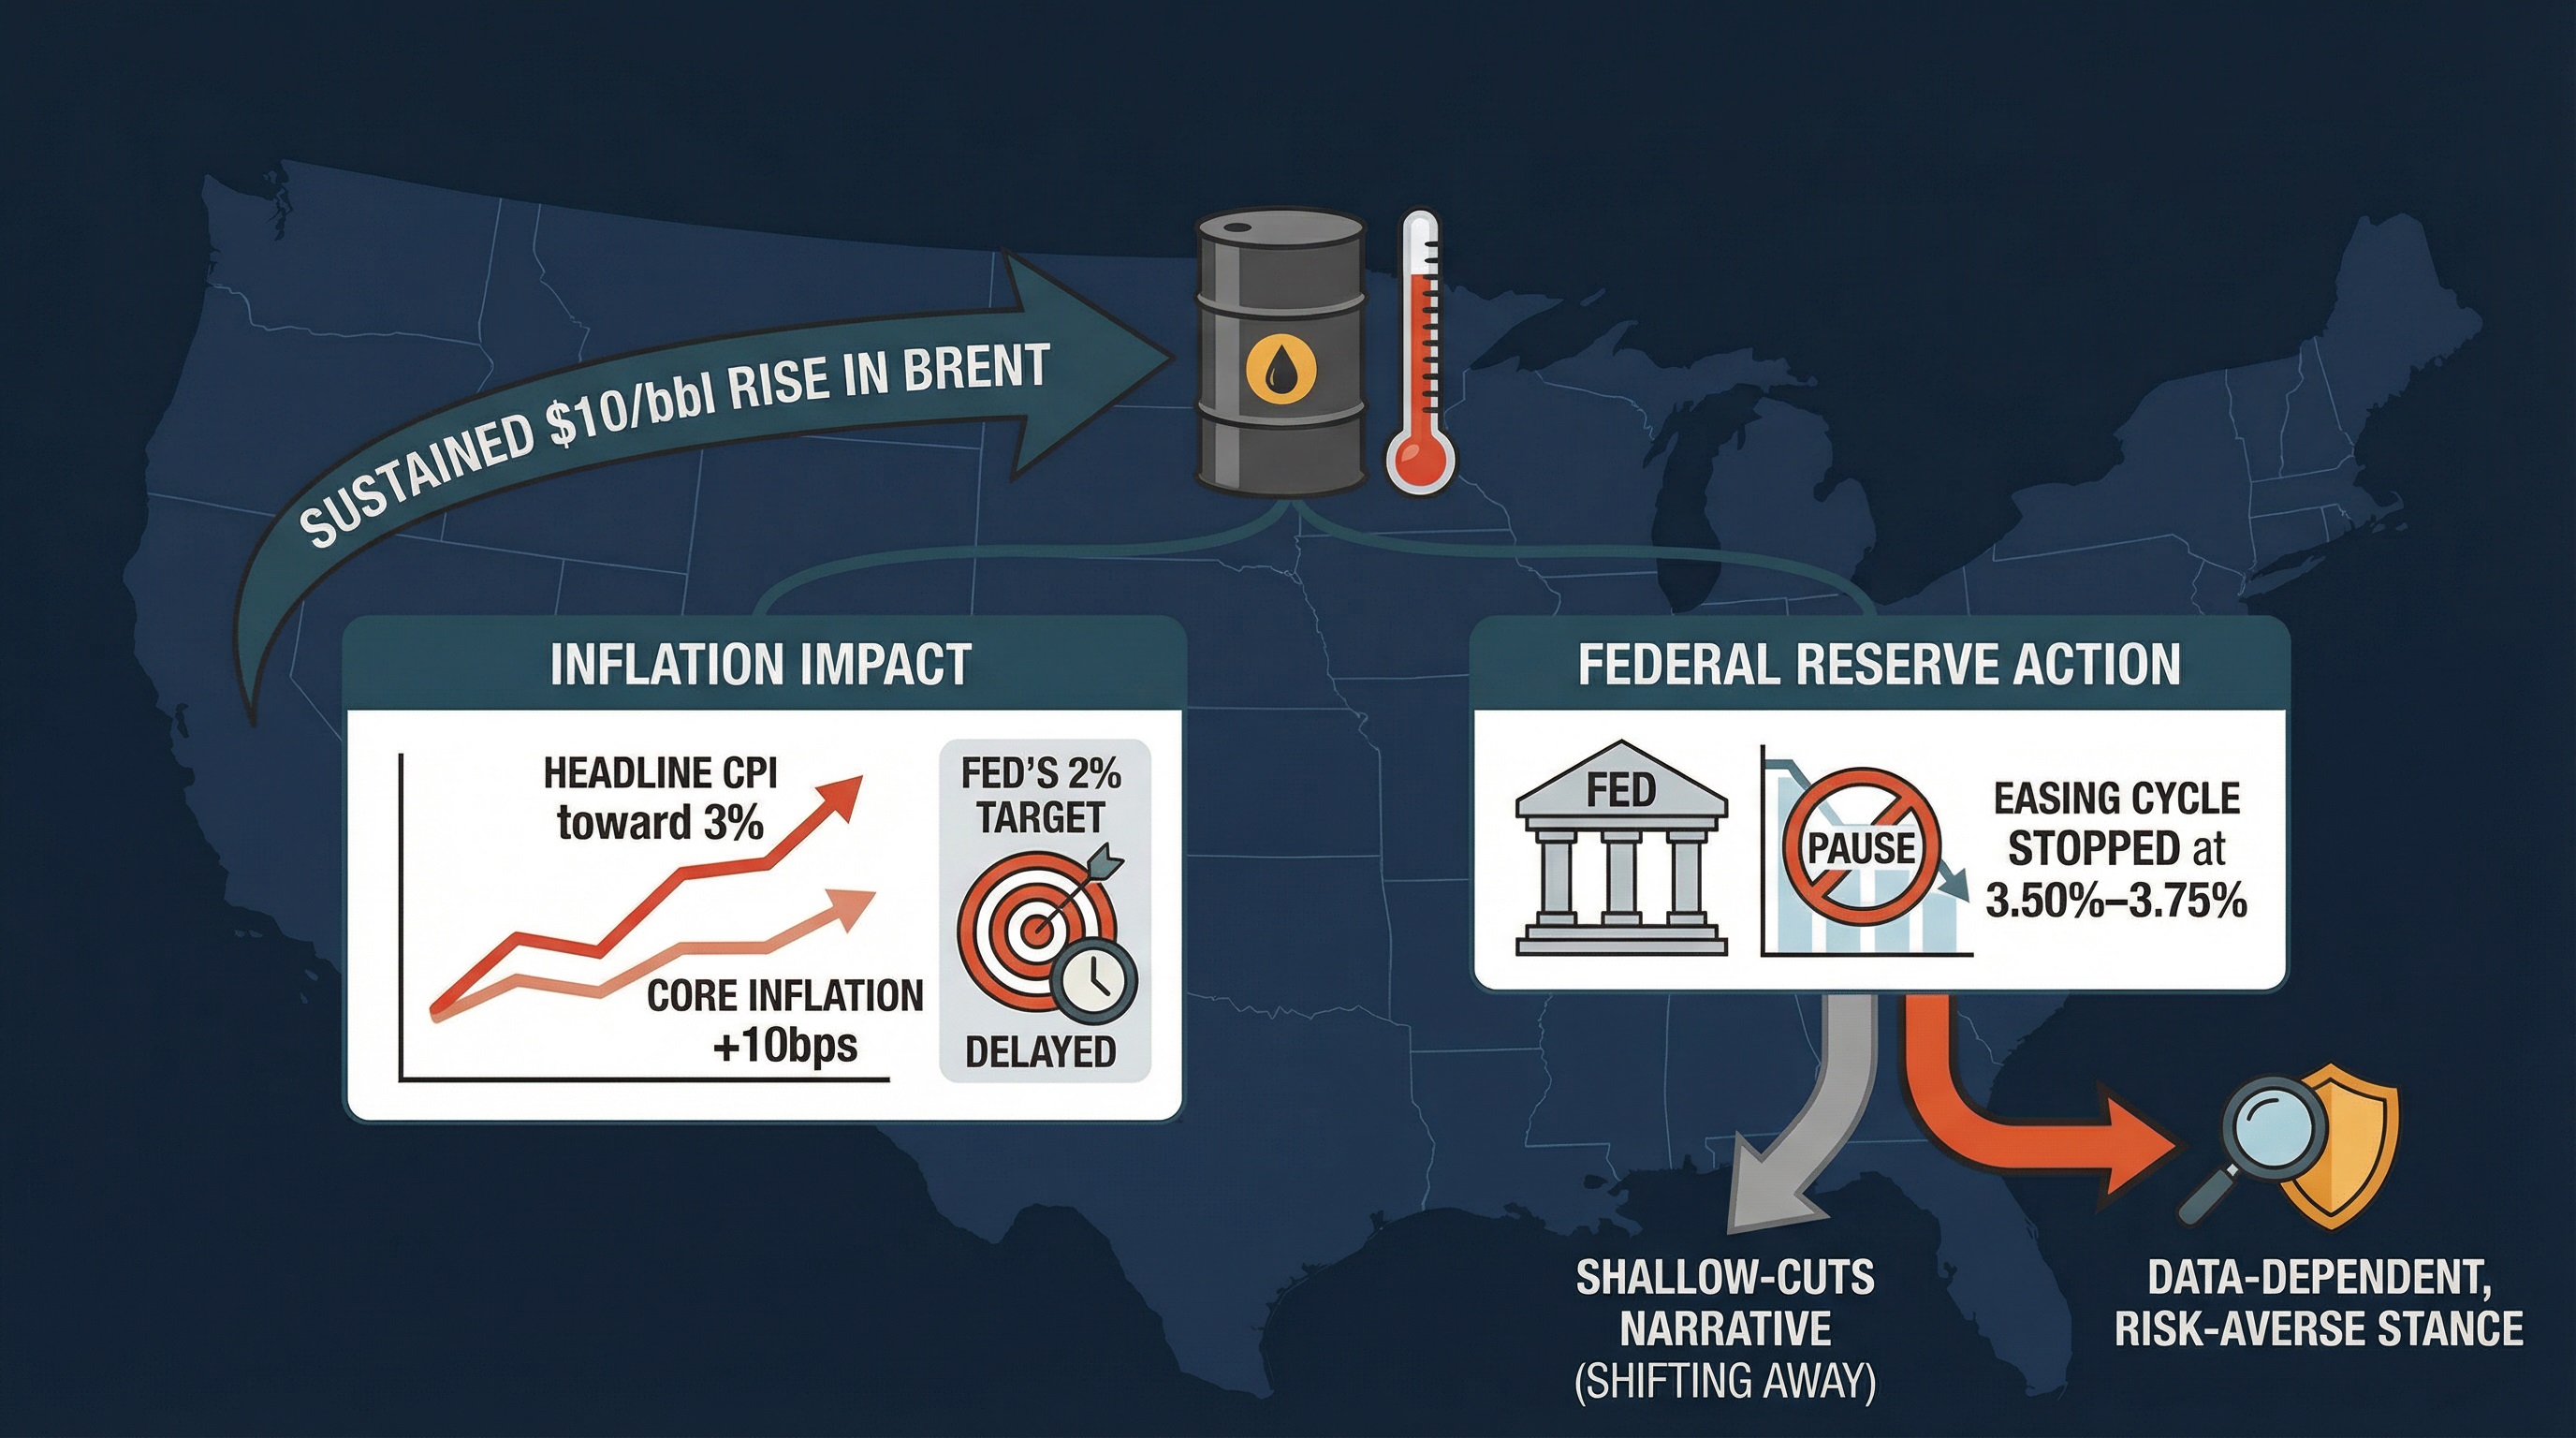
A sustained $10/bbl rise now adds roughly 10bps to core inflation and pushes headline CPI back toward 3%, delaying progress toward the Fed’s 2% target.
This shock has forced the Federal Reserve to pause its easing cycle at 3.50%–3.75%, shifting markets from a shallow-cuts narrative to a data-dependent, risk-averse stance.
The adjustment is most visible in:
- Treasury yields
- Real rates
- Dollar strength
- Credit spreads
- Equity risk premia
The curve is showing early signs of bear steepening as long-term yields rise in response to geopolitical inflation while front-end expectations stay anchored.
For capital-preserving portfolios, the US channel is decisive for managing duration risk, breakeven exposure, and sensitivity to Fed communication under a potential “stagflation-lite” backdrop.
China and Asia: The Center of Hormuz Exposure
Asia absorbs 90% of all crude that moves through Hormuz, making it the region most exposed to the 2026 shutdown.
The vulnerability is structural:
- High import dependence
- Limited short-term substitution
- Manufacturing and logistics built on stable energy flows
China’s position has shifted dramatically. Despite being one of Iran’s few strategic partners, Chinese tankers and container ships have almost completely halted transits since the IRGC declared the strait closed and began targeting commercial vessels. Dozens of Chinese ships are now stranded, and Beijing has been unable to secure guaranteed passage.
A sustained disruption would:
- Raise China’s landed energy costs
- Compress refining margins, especially for independents
- Pressure the yuan through trade-balance deterioration
- Reduce fiscal room for stimulus
- Slow energy-intensive industrial output
For investors, China’s demand elasticity remains the key swing factor for medium-term oil pricing. If Chinese intake slows, it tempers geopolitical premiums; if Beijing restarts flows or accelerates stockpiling, it magnifies them.
LNG Market Transmission: Supply Shock, Storage Stress, and Regional Divergence
LNG markets are reacting far more violently than oil. The closure of the Strait of Hormuz and the halt of Qatari production have removed ~20% of global LNG supply overnight, overwhelming the redeployment capacity of global infrastructure.
Europe
- Storage has fallen to seven-year lows (~22–29%), shifting the narrative from “adequate” to a high-cost storage scramble.
- The loss of Qatari volumes has forced competition for flexible cargoes, driving TTF above €55/MWh with risk of further spikes.
- Power markets transmit these costs immediately, and energy-intensive industry remains highly exposed.
Asia (Japan, South Korea, China)
- LNG remains a critical baseload input with low elasticity.
- Buyers are now outbidding Europe for Atlantic cargoes, widening the JKM–TTF spread and stressing strategic reserves.
- Price-sensitive importers (India, Pakistan, Bangladesh) face acute shortages as Qatar’s force majeure removes their primary supply source.
Global Outlook
A multi-month disruption would tighten both TTF and JKM, overwhelm remaining swing supply, and push volatility into fertilizers, petrochemicals, and metals. New U.S. and Canadian export capacity cannot offset the immediate loss of Middle Eastern volumes.
Commodity Correlations and Market Sentiment
Oil and gold are moving in line with crisis dynamics, but 2026 has broken several long-standing relationships. The Iran conflict and the shutdown of Hormuz have pushed commodities into distinct transmission channels that matter directly for portfolio construction.
Oil
Oil has shifted from a geopolitical barometer to a physical-supply shock asset.
- Brent is trading around $115–$120/bbl.
- A $10–$15/bbl risk premium is now embedded due to shipping disruption and Middle East outages.
- Traditional demand-side correlations are overridden by force majeure events and transport blockages.
Investor Takeaway: Oil now anchors inflation expectations and global shipping costs.
Gold

Gold’s reaction is being driven less by geopolitics and more by rates and liquidity.
- After hitting $5,100/oz, gold is under pressure from a stronger USD and higher real rates.
- Recent flows show profit-taking and liquidity-driven selling, not a collapse in safe-haven demand.
- The Fed’s pause has reinforced gold’s role as a real-rate hedge, not an automatic geopolitical hedge.
Investor Takeaway: Gold protects** against policy uncertainty**, not just conflict risk.
Industrial Metals
Industrial metals are moving on energy-driven supply constraints, not growth.
- High power costs are forcing smelter cuts, especially in aluminum.
- Supply disruptions dominate demand signals.
- Margin compression is visible in energy-intensive sectors.
Investor Takeaway: Metals express input-cost risk, not macro optimism.
Agriculture
Agricultural commodities are absorbing the second-order effects of energy inflation.
- Fertilizer, fuel, and transport costs are rising.
- Price pressure builds if energy disruption persists.
- Food-importing emerging markets face disproportionate risk.
Investor Takeaway: Agriculture becomes a hedge for feedstock inflation.
Portfolio Implications
For multi-asset portfolios, the conflict has fractured traditional correlations:
- Oil → inflation expectations, shipping cost pass-through
- Gold → real-rate hedging and central bank diversification
- Industrial metals → energy-cost volatility
- Agriculture → feedstock and logistics inflation
Implication for Investors: Hedge selection must now prioritize liquidity, rate sensitivity, and energy-exposure mapping, rather than relying on historical commodity relationships.
If these shifts across oil, gold, and commodities are affecting your exposure, connect with our experts for customized guidance on the most effective positioning options.
Transmission to Rates, Credit, and Equities
Rates
- US yields are rising as oil-driven inflation delays the Fed’s easing cycle; the 10-year Treasury is testing ~4.15%, with June cut odds falling sharply.
- European yields are moving higher as well, reflecting imported inflation rather than growth weakness.
- The curve is behaving as a bear steepener, with long-end inflation premia rising faster than short-end policy expectations.
Investor relevance: Duration risk increases; breakevens firm; rate volatility stays elevated.
Credit
- EM sovereigns heavily reliant on energy imports (India, Pakistan) are seeing spreads widen as weaker currencies meet higher USD funding costs.
- HY energy names hold up better due to strong upstream margins at $100+ oil, but risk appetite across broader HY is deteriorating.
- Corporate issuers exposed to logistics and global transport face widening CDS spreads as freight costs and input prices rise.
Investor relevance: Credit selection becomes bifurcated—energy-positive, import-dependent negative.
Equities
Likely beneficiaries:
- Integrated oil & gas
- LNG carriers and tanker operators
- Aluminum producers facing supply-tightening
- Defensive sectors (Pharma, IT services) viewed as cost-insulated
Likely underperformers:
- Airlines and transport operators
- Auto manufacturers facing margin compression
- Chemical producers
- Domestic banks sensitive to higher-for-longer rate trajectories
Investor relevance: Sector dispersion widens; capital-preservation mandates tilt toward quality balance sheets, defensive earnings, and volatility overlays.
FX Implications
The US dollar is experiencing a liquidity-driven surge, with DXY approaching 100 as investors prioritise access to USD funding during the energy shock.
This creates a double squeeze for energy-importing EM currencies that must buy more expensive oil precisely when dollars are scarcest.
Shifts in Traditional Safe Havens
- Japanese yen: Its haven status is weakening; USD/JPY has moved toward 158 as high oil prices erode Japan’s terms of trade.
- Swiss franc: Remains defensive, though the SNB is signalling readiness to curb excessive strength to protect exporters.
Most Exposed Currencies
Currencies facing the sharpest energy-pass-through pressures include:
- Indian rupee, now at record lows near 92.6
- Philippine peso
- Turkish lira
- Egyptian pound
Middle Eastern dollar-pegged currencies remain stable, but sovereign liquidity management is tightening as regional risk rises.
Investor Relevance
FX risk is now a central transmission channel. Multi-region allocators must shift from static hedging to active management of oil-volatility and USD-funding correlations.
Global Growth and Inflation Pathways: Scenario Sensitivity
Investors should model outcomes across short, medium, and long horizons as the 2026 energy shock reshapes inflation, policy, and growth trajectories.
Short-Term (1–3 months)
The Price & Policy Shock
- Oil holds near $120/bbl; LNG supply contracts after Qatar’s force majeure.
- Headline inflation projections in the US and Europe rebound toward 3%.
- Central banks shift to a hawkish pause, delaying easing cycles.
- Volatility rises as markets reprice growth and liquidity risks.
Medium-Term (3–12 months)
Demand Compression & Supply Chain Stress
- Persistent disruption slows growth in Europe and Asia, especially energy-intensive sectors.
- Europe faces a challenging summer restocking with inventories near seven-year lows.
- EM weakness broadens as import bills surge and currencies come under pressure.
- Corporate margins compress across chemicals, fertilizers, and metals, leading to risk-asset derating.
Long-Term (>12 months)
Structural Realignment
- Normalisation will depend on how long supply constraints persist and the scale of strategic stock releases.
- Governments accelerate diversification away from Hormuz through LNG infrastructure, domestic renewables, and nuclear capacity.
- Supply chains continue shifting from efficiency-first to resilience-first models as geopolitical risk becomes a central driver.
Strategic Positioning for Investors in a Volatile Market

Investors aiming to preserve capital while capturing selective upside should prioritise the following:
1. Tilt Toward Energy Producers and Energy-Security Infrastructure
Upstream producers remain the cleanest beneficiaries of $115+ oil. Add selective exposure to LNG regasification, storage operators, and European infrastructure, which are outperforming as Middle Eastern supply disappears. Avoid tanker firms reliant on Hormuz; favour those servicing Atlantic and Mediterranean diversions.
2. Use Oil as an Inflation Hedge—Not a Directional Macro Bet
Consider using:
- Brent call spreads
- Integrated energy equities
- Long Brent / short EM energy importers
- Brent–WTI spread widening, which directly reflects Hormuz disruption
3. Track LNG Spreads for Macro Stress Signals
The TTF–JKM spread now indicates relative economic strain between Europe and Asia. A sharp narrowing implies a global bidding war for scarce volumes and rising industrial risk.
4. Strengthen Defensive Components with Real-Rate Awareness
Gold remains relevant but is reacting to real-rate pressure as the Fed pauses easing. Pair it with TIPS and quality balance-sheet equities that can absorb energy-led cost shocks.
5. Reduce Exposure to Energy-Intensive Industries
Margin compression is non-linear across chemicals, fertilizers, metals, autos, and transport operators. Avoid sectors unable to pass through higher feedstock costs.
6. Shorten Duration and Reassess Rate Sensitivity
The US curve is bear-steepening as 10-year yields rise above 4.1%. Keep duration short and rotate toward high-quality short-dated credit until inflation premia stabilise.
7. Strengthen FX Hedging for Import-Dependent Markets
The USD surge and rising oil costs create a double squeeze for currencies like the INR, PHP, TRY, and EGP. Active hedging—not static overlays—is essential for EM and Asian allocations.
Conclusion: Navigating a Transmission-Driven Market
Iran’s economic weakness is well-documented, but its influence on global markets stems from geography, not GDP. The effective closure of the Strait of Hormuz has shifted the current environment from a theoretical chokepoint risk to an active supply-chain rupture that is reshaping pricing across oil, LNG, rates, FX, and credit.
For investors focused on capital preservation and risk-adjusted returns, the priorities have moved beyond monitoring to tactical positioning across:
- Energy chokepoint exposure
- Commodity and volatility trajectories
- Inflation and rate-path sensitivity
- Regional growth impacts
- Cross-asset transmission channels
Iran is not an investable economy under current conditions, but its ability to disrupt energy flows now drives some of the most important global macro signals—oil volatility, EM currency pressure, funding-market stress, and the re-pricing of central-bank expectations.
The appropriate stance is disciplined and selective: preserve liquidity, hedge asymmetrically, and map scenarios around an extended energy disruption. The opportunity is not in predicting political outcomes, but in understanding how this shock transmits across markets and positioning accordingly.
The market is moving quickly, and so should your strategy. Book a consultation with our specialists to target high-conviction opportunities and reinforce your defensive positioning.
This article is for general information only and does not constitute financial, legal or tax advice. Rules, prices and regulations change; verify current requirements with a qualified adviser before acting.