Global markets entered March 2026 under the heaviest geopolitical pressure seen in decades. Coordinated military operations by the United States and Israel against Iran have escalated into a multi-front regional war, triggering a rapid flight to safety across commodities and fixed income.
The effective shutdown of the Strait of Hormuz, disruptions to Gulf infrastructure, and the killing of Iran’s Supreme Leader have reshaped risk pricing almost overnight. Oil has moved from surplus-driven softness to a logistics-driven spike, and gold has broken into previously untested price territory as the Middle East conflict continues to intensify.
This report provides a structured overview of the current environment, the market dislocations in oil and bullion, and a practical framework for investors navigating the volatility.
To reassess your portfolio in light of the oil and gold surge, connect with our advisors for tailored guidance on your best positioning options.
Geopolitical Situation: A Multi-Front Regional Crisis
The crisis was set in motion on February 28, 2026, when U.S. and Israeli forces launched Operation Epic Fury, targeting Iranian military, cyber, and nuclear-linked sites.
The initial wave resulted in the confirmed death of Iran’s Supreme Leader, Ayatollah Ali Khamenei, triggering a leadership vacuum and accelerating internal unrest.
Cross-Regional Combat Expansion
Within 48 hours, hostilities expanded beyond Iran:
- Lebanon (Beirut): Hezbollah operations intensified against Israeli targets.
- Syria: Airstrikes and drone attacks increased around former regime strongholds.
- Yemen: Houthi units launched projectiles toward Red Sea shipping corridors.
- Gulf States: Missile and drone attacks were reported in the United Arab Emirates, including impacts near Dubai and Bahrain.
- U.S. Bases: A major attack on a U.S. installation in Kuwait killed several personnel.
Several Gulf equity markets—including exchanges in Abu Dhabi and Kuwait City—temporarily suspended trading due to volatility.
Strait of Hormuz: Functional Shutdown
The Strait of Hormuz, through which roughly 20% of global seaborne crude moves, is effectively sealed.
Key impacts:
- Over 150 oil and LNG tankers are stranded or rerouted.
- Major carriers, including Maersk, have halted transits.
- War-risk insurance has been revoked or priced prohibitively high.
This chokepoint disruption has single-handedly reshaped the global energy risk premium.
Regional Political Fragmentation
- Iran: Leadership uncertainty, hyperinflation, water shortages, and public unrest now intersect with wartime mobilization.
- Syria: The post-Assad government under Ahmed al-Sharaa is battling “Shadow Government” factions and an ISIS resurgence.
- OPEC+ Response: A planned 206,000 bpd production increase for April is now largely symbolic. With export routes blocked, spare barrels remain effectively stranded.
The geopolitical trajectory remains highly fluid, with the risk of additional states being drawn in if escalation persists.
Oil Market Impact: From Surplus to Shock

Oil markets responded instantly to the dual shock of widening conflict and acute supply-chain paralysis.
What had been a surplus-leaning market only weeks earlier has now flipped into a structurally constrained environment driven by logistics, security risks, and impaired export routes.
Price Spike Across Benchmarks (March 2–3, 2026)
| Benchmark | Price Range | Daily Move | Key Driver |
|---|---|---|---|
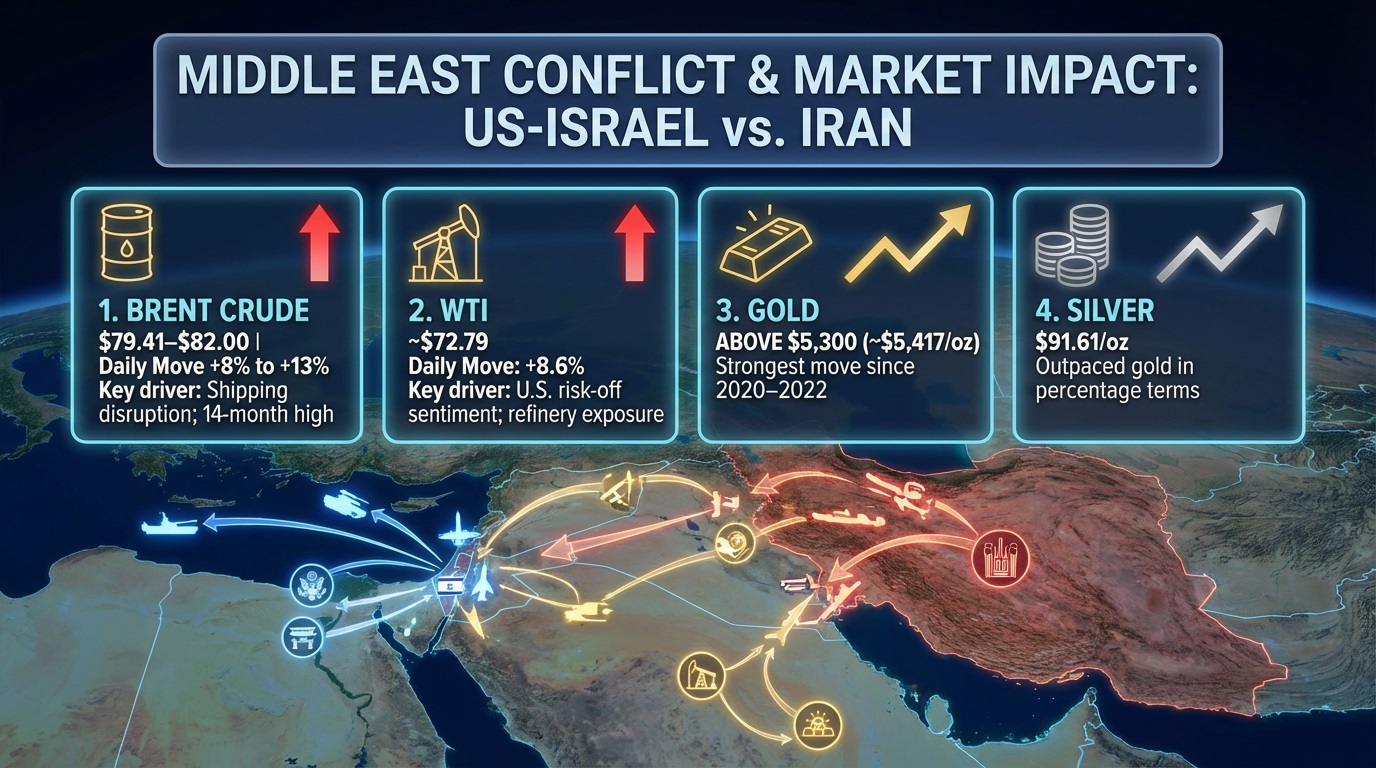
| Brent Crude | $79.41–$82.00 | +8% to +13% | Shipping disruption; 14-month high |
| WTI | ~$72.79 | +8.6% | U.S. risk-off sentiment; refinery exposure |
| Global Basket | ~$78.00 | +10% | Broad energy inflation; rerouting delays |
Market strategists estimate a $20–$40/bbl geopolitical risk premium now embedded in pricing.
Forecasts that previously anticipated Brent averaging near $60 in 2026 are no longer relevant—physical deliverability now outweighs fundamental supply models.
Why This Price Shock Is More Severe Than Typical Geopolitical Rallies
- Logistics, not supply, are constrained. Even if OPEC+ increases output, barrels cannot reliably exit the Gulf.
- Insurance withdrawal has raised costs structurally. War-risk premiums at Lloyd’s have surged or been revoked entirely.
- Refining exposure amplifies volatility. Facilities such as Saudi Arabia’s Ras Tanura briefly reduced operations due to debris impacts.
- Rerouting around the Cape of Good Hope adds 10–14 days to transit times, raising global freight and input-cost inflation.
These factors together create a supply-side shock that fundamental models—built on expected 2026 surpluses—did not price in.
Technical Structure: Brent’s Breakout
- Immediate resistance: $85 — a major multi-year pivot.
- Breakout target: $90–$100 if the Strait of Hormuz remains non-operational for more than 72 hours.
- Support levels: $72.50 (recent high) and $60 (pre-conflict fair value).
The structure now reflects a market dominated by geopolitical risk, not marginal-cost economics.
Macro Impact
- Net-importing economies face widening deficits as energy costs rise sharply.
- Aviation, shipping, and logistics sectors experience immediate margin compression.
- Central banks may delay or reconsider rate-cut cycles, given the inflation impulse from higher oil and transport costs.
Gold Market Impact: Safe-Haven Rush
Gold has entered a decisive breakout phase as investors shift capital toward liquidity, durability, and systemic risk hedges.
The acceleration in gold prices is no longer a typical “risk-off” reaction—current flows reflect a broad reassessment of geopolitical stability and the fragility of global energy corridors.
Record Price Levels
- Global Spot Gold: Broke above $5,300, reaching approximately $5,417/oz, marking its strongest move since the 2020–2022 volatility cycle.
- Market Drivers: A convergence of geopolitical escalation, shipping risk, elevated energy prices, and uncertainty around central bank trajectories has driven institutional and sovereign demand sharply higher.
Forward Targets
Leading banks—including J.P. Morgan and Goldman Sachs—now place year-end 2026 targets between $6,000 and $6,300/oz, assuming continued instability in the Middle East and prolonged impairment of the Strait of Hormuz transit routes.
Technical Structure
- Immediate Resistance: $5,500, considered the next major psychological and structural barrier.
- Institutional Support Zones:
A sustained weekly close above $5,500 could trigger a “vacuum rally”—a technical condition where limited overhead supply accelerates moves toward upper targets.
The Dollar–Gold Correlation Break

Both gold and the U.S. Dollar Index (DXY) are rising simultaneously—an unusual pairing that historically signals systemic fear rather than inflation hedging.
This dual appreciation indicates investors are hedging against:
- geopolitical disorder
- supply-chain fragility
- tightening global liquidity
- reduced confidence in traditional risk assets
The correlation break is one of the clearest markers of the current market regime shift.
Silver’s High-Beta Response
Silver has outpaced gold in percentage terms, reaching $91.61/oz.
As a metal with both monetary and industrial demand, its outperformance reflects concerns over:
- electronics supply chains
- solar component manufacturing
- potential regional production disruptions
If conflict escalates, silver testing the $100 level is increasingly plausible.
If you're evaluating how energy volatility and the surge in precious metals should influence your broader allocation, our advisors can help you frame a strategy that aligns with your goals. Click here to book a private consultation.
Deeper Market Dynamics Investors Must Track as the Middle East Conflict Intensifies
Iranian Succession: The Critical Unknown
The death of Khamenei creates two destabilizing outcomes:
- Hardline consolidation under the IRGC
- Fragmentation and potential central government collapse
Neither scenario offers a short-term path to diplomatic de-escalation.
LNG and Broader Energy Logistics
The Strait carries 20% of global LNG traffic, not just crude. Europe began 2026 with lower reserves (46 bcm vs. 60 bcm in the prior year), leaving pricing vulnerable. Asia and Europe are now in direct competition for spot cargoes.
Insurance, Freight, and Rerouting Costs
War-risk premiums have tripled or disappeared entirely.** **Rerouting via southern Africa adds meaningful inflationary pressure and delays downstream supply chains.
OPEC+ Friction
The bloc’s announced production increase is technically irrelevant until the Gulf becomes navigable.
Additionally:
- Saudi fiscal balance requires oil near $80+
- Prolonged war threatens mega-projects like NEOM
Currency and Fixed Income Movements
- Dollar strength tightens global liquidity.
- Yen and Rupee face downward pressure due to energy costs.
- Long-duration bonds weaken as inflation expectations rise; short-duration instruments gain demand.
Asset-Class Deep Dive for Investors
1. Gold (XAU/USD): Structural Breakout Confirmed

Gold has moved beyond a conventional safe-haven rally and into a systemic-risk breakout, driven by geopolitical uncertainty and a reassessment of global liquidity conditions.
- Current Price: ~$5,407/oz
- Bullish Above: $5,500 — A sustained weekly close above this level would confirm the next leg toward the $6,000–$6,300 institutional targets.
- Bearish Below: $5,050 — A break under this zone signals short-term cooling but does not alter the broader structural uptrend.
Gold’s trajectory reflects expectations of a prolonged conflict rather than speculative excess.
The metal is now trading as a hedge against geopolitical instability, shipping disruption, and currency volatility.
2. Brent Crude: Volatility Engine for Global Markets
Brent has transitioned from a supply-adequate environment to a logistics-driven risk market, with the Strait of Hormuz operating as a de facto choke point.
- Current Price: ~$82/bbl
- Breakout Above $85: Opens the path toward $90–$100 as physical flows remain impaired.
- Breakdown Below $72: Would indicate the market is pricing de-escalation, improved shipping conditions, or a demand slump.
A widening Brent–WTI spread would further confirm that international markets are absorbing Middle Eastern disruptions more severely than U.S. benchmarks, signalling persistent structural stress in global energy logistics.
3. Market Sentiment Indicators
VIX (Equity Volatility Gauge)
- Above 30: Indicates entrenched fear and cautions against premature equity accumulation.
- The recent upward trend reflects nervous positioning rather than full panic, but volatility remains highly sensitive to geopolitical headlines.
DXY (U.S. Dollar Index)
- Above 106: Risks constraining further oil upside by suppressing demand from energy-importing economies.
- The rare simultaneous rise of both USD and gold signals a broad flight to quality, with investors hedging sovereign, commodity, and currency risks simultaneously.
Investor Strategy Under Geopolitical Stress
Portfolio Positioning Framework
Navigating this environment requires structured portfolio adjustments that balance risk control with selective opportunity. The following framework outlines where to act and where to exercise caution.
A. Equities
- Reduce: Airlines, travel, consumer discretionary, high-beta tech.
- Maintain/Increase: Defense contractors, diversified energy firms, select utilities.
- Monitor: Companies with large Gulf exposure in logistics, ports, and aviation.
B. Fixed Income
- Shift toward short-duration instruments.
- Avoid long-duration bonds due to inflation uncertainty.
- EM oil-exporter sovereign bonds may provide tactical opportunities.
C. Commodities
- Maintain or increase exposure to gold and silver as hedges.
- Energy exposure should be risk-managed, using structured products or options rather than directional futures for most portfolios.
D. Currency Management
- Hedge EM currency exposure where possible.
- Favor selective USD and CHF allocations until volatility normalizes.
E. Scenario Planning
Investors should construct playbooks around three paths:
- Short conflict, rapid normalization
- Prolonged stalemate
- Regional escalation
Liquidity & Risk Controls
- Maintain higher-than-normal cash buffers.
- Avoid leveraged positions in volatile sectors.
- Stress-test portfolios under oil scenarios of $90, $110, and $130.
What Not to Do
- Do not chase short-term oil spikes without risk limits.
- Do not assume a quick diplomatic resolution.
- Do not over-concentrate in a single defensive asset.
Conclusion
The transition from geopolitical tension to full-scale regional conflict has redefined global market dynamics. The closure of the Strait of Hormuz, leadership instability in Iran, and expanded combat zones signal that uncertainty will persist. Oil has shifted from a supply-adequate market to a logistics-driven risk environment, while gold has become the premier global hedge.
Investors should adopt a pragmatic stance: defensive positioning, disciplined risk management, exposure to safe-haven assets, and scenario-based planning. The situation remains fluid, and markets will continue to reprice risk as events evolve. Maintaining flexibility, liquidity, and strategic diversification is essential until clearer geopolitical trajectories emerge.
For personalised guidance based on your objectives and risk profile, book a private consultation with our specialist team. Our experts will help you position your portfolio to take advantage of current opportunities across oil and precious metals.
This article is for general information only and does not constitute financial, legal or tax advice. Rules, prices and regulations change; verify current requirements with a qualified adviser before acting.