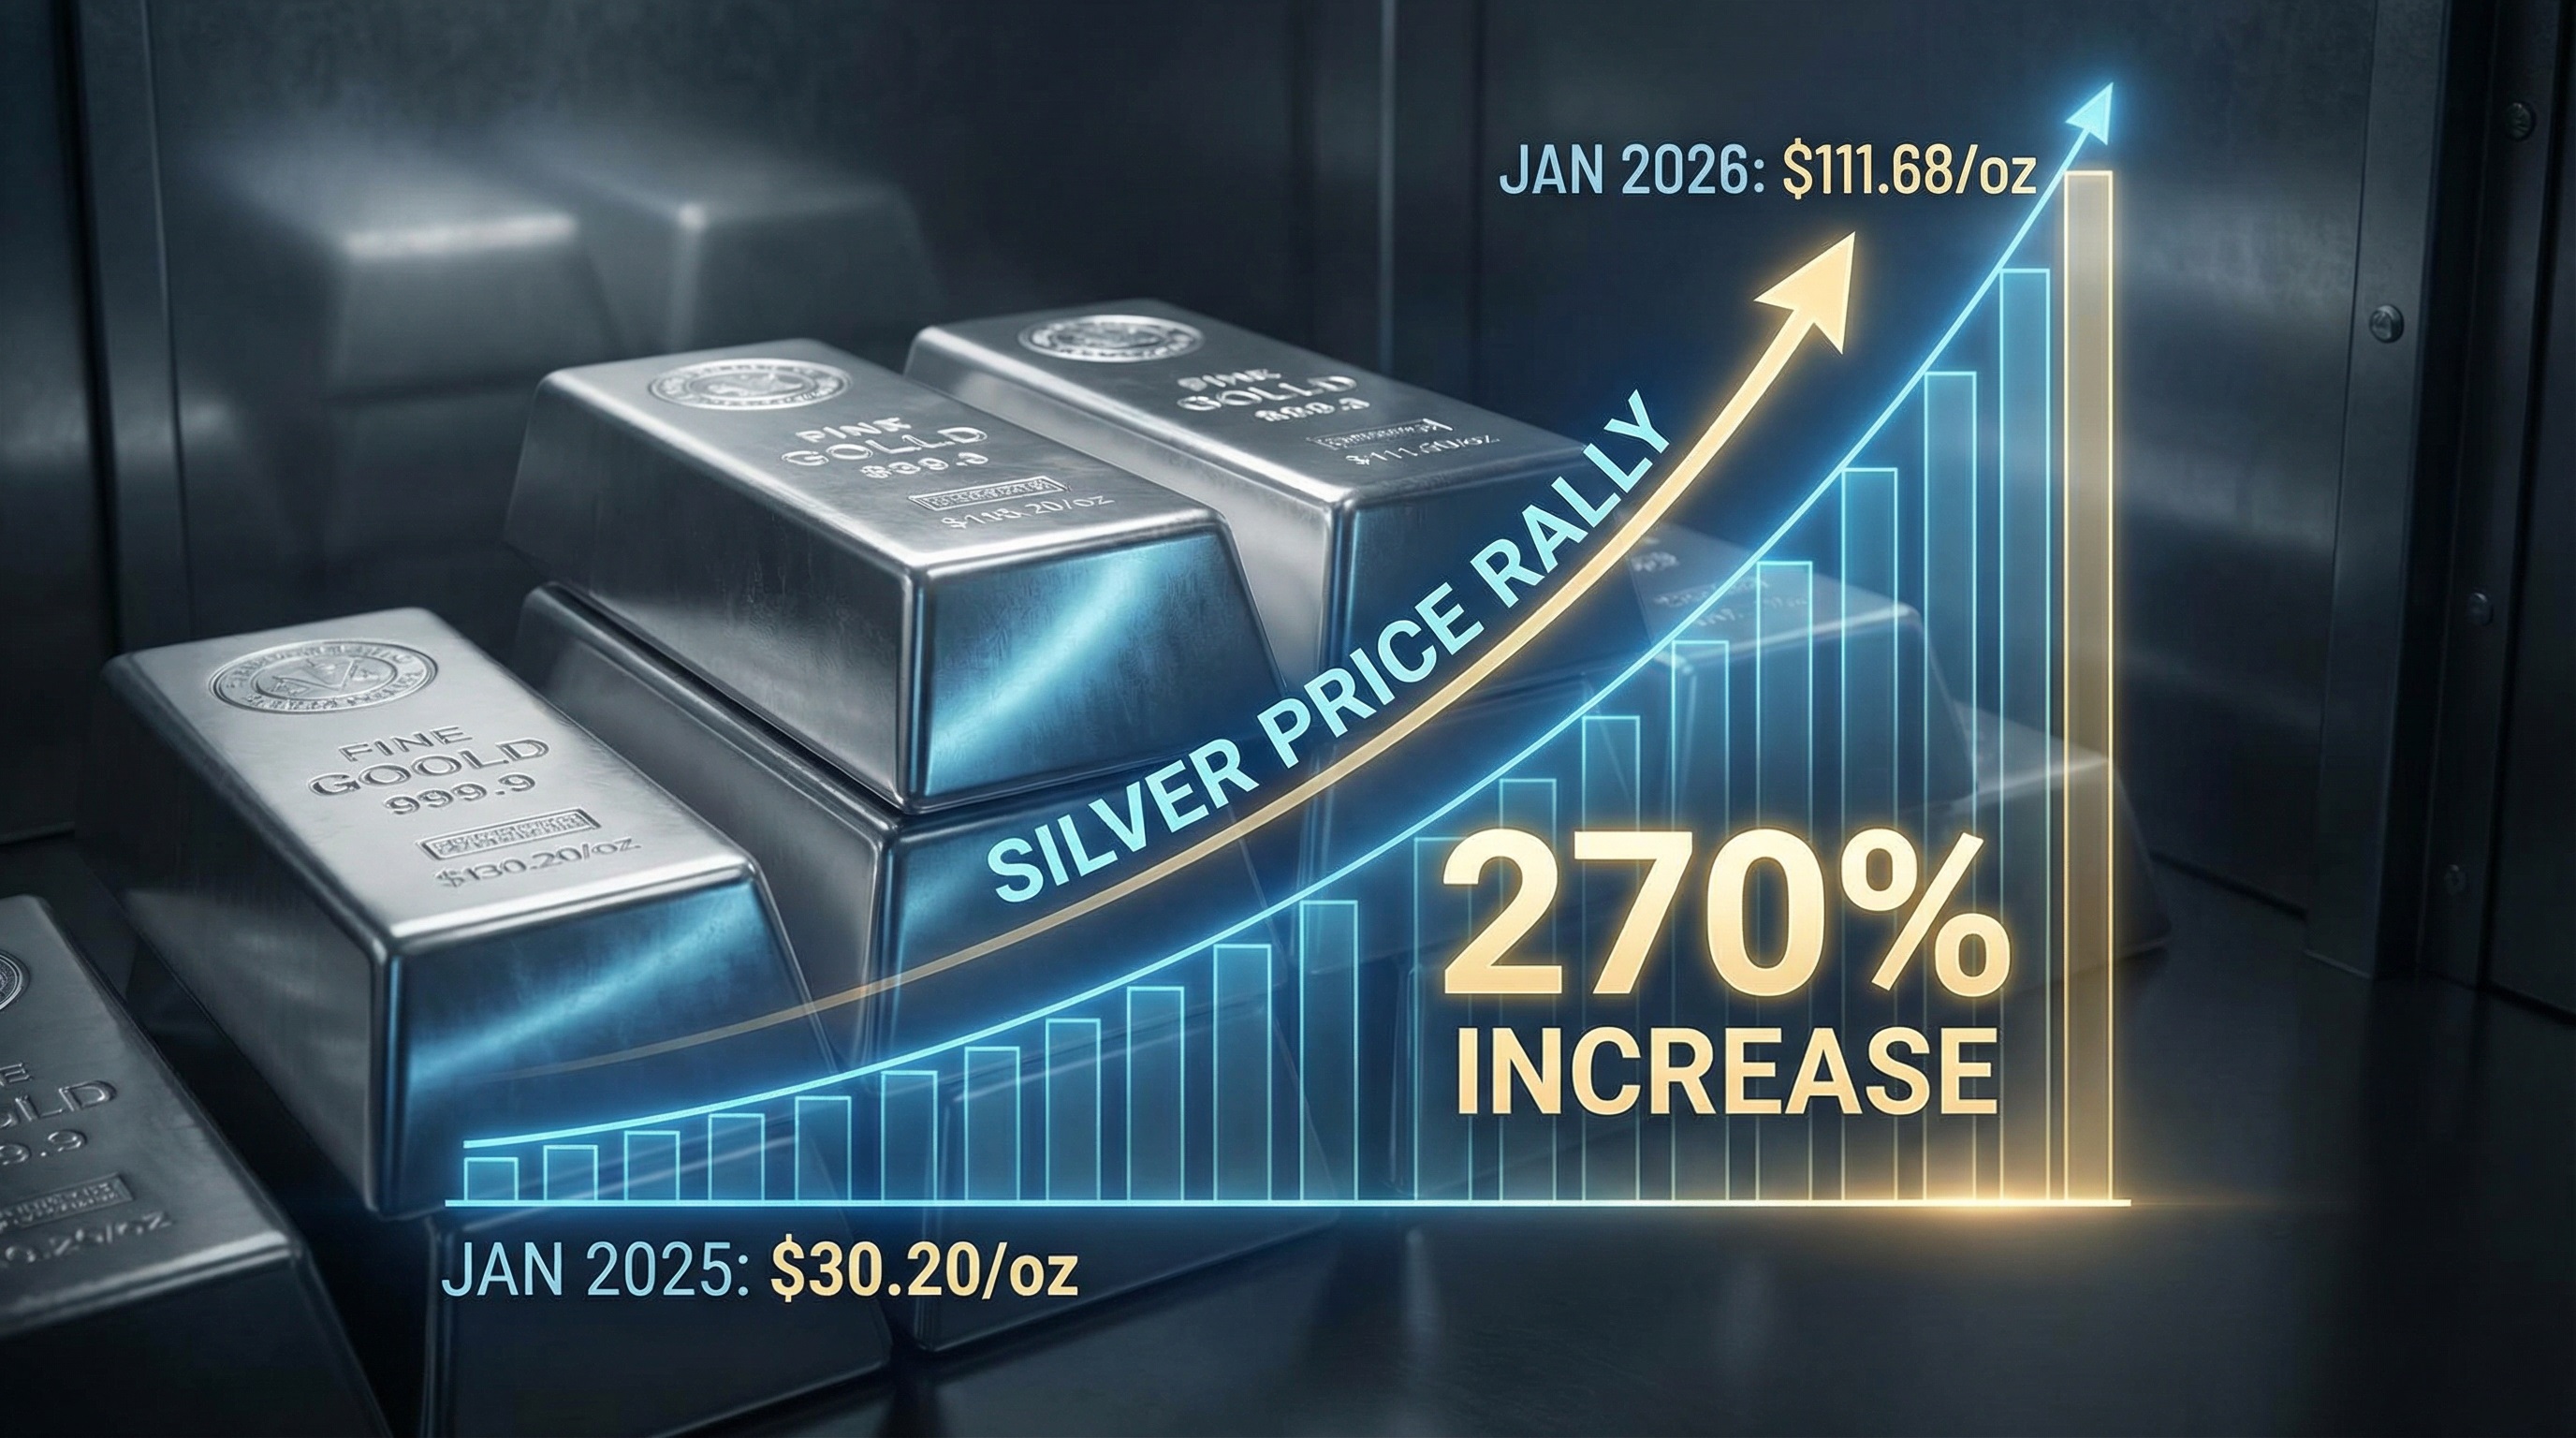
Silver has delivered one of the most spectacular performances in precious metals history, surging from $30.20 per ounce in January 2025 to $111.68 per ounce by January 27, 2026—a remarkable 270% gain in just twelve months. This explosive rally represents a confluence of structural supply deficits, unprecedented industrial demand, geopolitical tensions, monetary policy shifts, and a historic short squeeze that has fundamentally revalued the metal's strategic importance.
Silver has decisively broken out of its decades-long price suppression, transitioning from a primarily monetary asset to a critical industrial commodity essential for the global energy transition, defense technologies, and advanced electronics.
The price action reflects more than speculative fervor. Five consecutive years of structural supply deficits totaling over 820 million ounces (2021–2025), China's January 2026 export restrictions removing 60–70% of global refined silver from open trade, and silver's designation as a U.S. critical mineral have created a supply shock against inelastic industrial demand. The market has entered deep backwardation—a phenomenon last observed at the 1980 peak—signaling acute physical scarcity.
This report examines the fundamental drivers, supply-demand dynamics, price correlations, production economics, and forward-looking risk factors shaping silver's trajectory into 2026 and beyond.
Explore how silver and other precious metals align with your investment strategy—speak with our expert advisors** for guidance tailored to your goals.**
Historical Context and Price Performance
Five-Year Price Trajectory
Silver's price evolution from 2021 through early 2026 reveals a market that remained range-bound for four years before experiencing a parabolic breakout. From January 2021 ($27.18/oz) through January 2024 ($23.64/oz), silver traded within a narrow $22-28 range despite rising inflation and monetary stimulus. This consolidation phase masked accumulating structural pressures that would ultimately catalyze the 2025-2026 rally.
The breakout commenced in mid-2024 as industrial demand—particularly from solar photovoltaics—began overwhelming mine supply growth. By January 2025, silver had advanced to approximately $30.20/oz, marking the beginning of sustained upward momentum. The rally accelerated dramatically through 2025, driven by deepening supply deficits, ETF inflows exceeding 95 million ounces by mid-year, and growing recognition of silver's strategic importance.
Several inflection points punctuated the ascent. On June 17, 2025, silver breached $37.12—a 13-year high—as industrial demand surged and supply shortages intensified. By October 2025, the metal broke through its 1980 all-time high of $54.56, entering uncharted territory amid a historic short squeeze. The rally continued through year-end 2025, with silver closing around $71-72/oz after reaching intraday peaks near $83.60.
The new year brought renewed momentum. Silver crossed the psychological $100 barrier in mid-januira 2026, propelled by a weaker U.S. dollar, persistent geopolitical tensions, and continued supply constraints. President Trump's tariff threats targeting European nations over Greenland—announced in mid-January—triggered safe-haven flows that pushed silver to successive record highs. By January 27, 2026, silver traded at $111.68/oz, representing a gain of approximately 270% from twelve months prior.
Performance Relative to Other Assets
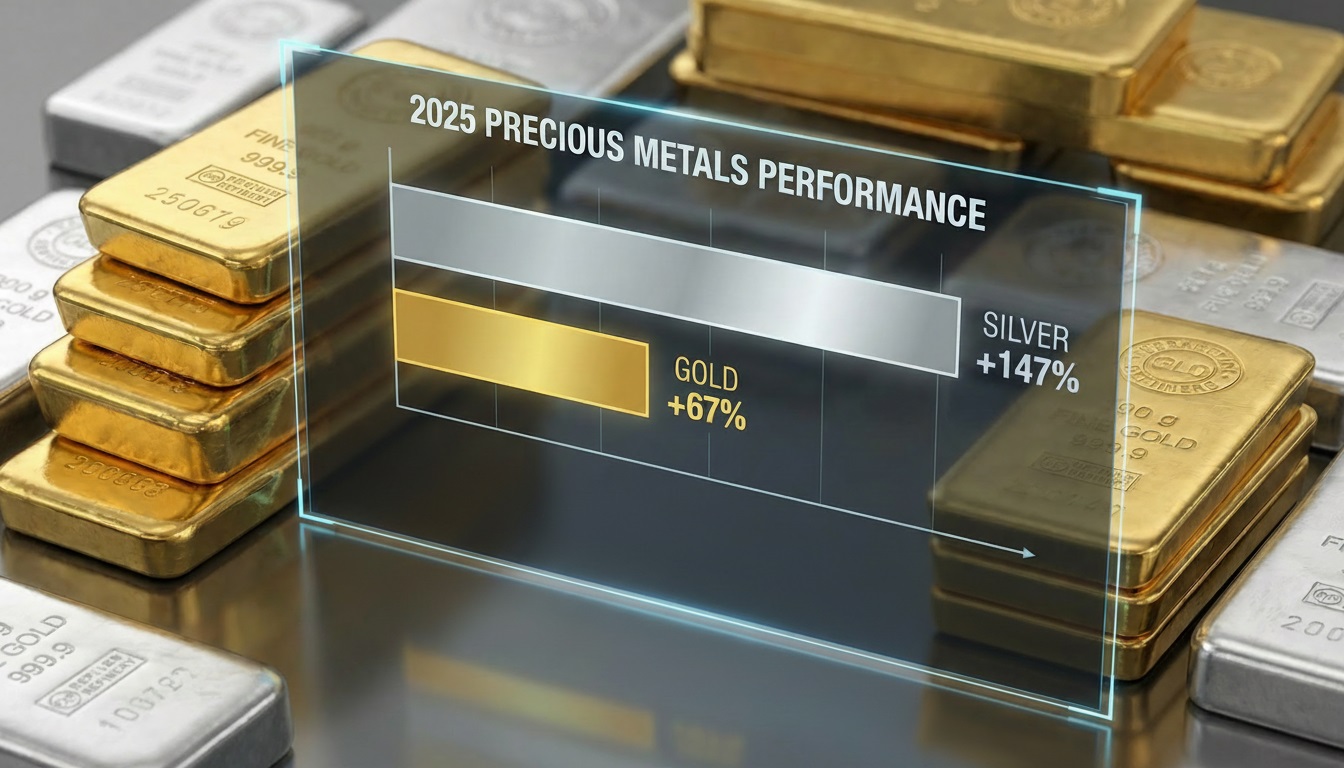
Silver's 2025 performance significantly outpaced other precious metals and most asset classes. While gold delivered an impressive 67% gain in 2025—marking one of its strongest years in decades—silver surged 147%, more than doubling gold's returns. This outperformance compressed the gold-silver ratio from above 100:1 in April 2025 to approximately 46-57:1 by early 2026, returning the ratio to levels last seen in 2013.
The magnitude of silver's gains exceeded even the most bullish forecasts issued at the beginning of 2025. Most institutional projections clustered between $30-50/oz for 2025, with the most optimistic scenarios suggesting $70-80 by the end of the decade under extraordinary conditions. Reality vastly exceeded these expectations, as silver's unique position at the intersection of monetary and industrial demand created amplified volatility.
Silver ETFs emerged as standout performers in 2025, delivering **over 160% returns **and significantly outperforming equities, bonds, and most commodities. The rally attracted substantial retail and institutional participation, with investment demand—measured through bars, coins, and ETF inflows—surging to multi-year highs despite prices rising to levels that would typically suppress physical purchases.
The Structural Supply Deficit
Five Consecutive Years of Shortfalls
The foundation of silver's price surge rests on a persistent structural imbalance between supply and demand that has intensified since 2021. The market has experienced five consecutive years of deficits, with cumulative shortfalls from 2021-2025 totaling approximately 820 million ounces. This represents roughly 10 months of global mine production being drawn from above-ground inventories to meet consumption requirements.
Silver has experienced five consecutive years of structural supply deficits (2021-2025), with cumulative shortfalls exceeding 820 million ounces as demand consistently outpaces mine production.
Annual deficit magnitudes have fluctuated but remained substantial throughout the period. The 2021 deficit reached 111 million ounces as post-pandemic industrial activity rebounded. The imbalance widened to** 224 million ounces in 2022** and peaked at** 257 million ounces in 2023** as solar photovoltaic demand accelerated while mine production remained flat. The 2024 deficit moderated to approximately 182 million ounces, and preliminary 2025 estimates suggest a shortfall near 95-170 million ounces depending on final demand calculations.
These sustained deficits have progressively drained above-ground stockpiles held in exchange warehouses and refinery vaults. London Bullion Market Association (LBMA) vaults—the world's largest over-the-counter precious metals trading center—contained approximately 924 million ounces, both allocated and unallocated, as of the end of September 2025. However, Morgan Stanley analysis indicates that 60% of London silver stocks were allocated to silver-backed ETFs, rendering the metal effectively unavailable for industrial users.
The cumulative drain on freely tradable inventories created unprecedented tightness in physical markets during late 2025. Shanghai Futures Exchange silver stocks fell to 920 tons in October 2025—the lowest level since May and representing the largest weekly outflow in 11 years—as Chinese industrial consumers competed for scarce supplies.
China's Export Restrictions: A Game-Changing Policy Shift
On January 1, 2026, China implemented a transformative licensing system for silver exports that fundamentally altered global supply dynamics. The new regulations reclassify silver as a strategic material similar to rare earth elements, requiring government-issued licenses for all export shipments. Only state-certified companies producing at least 80 tons annually and holding credit lines exceeding $30 million qualify for authorized trading enterprise status.
The policy places approximately 60-70% of the world's refined silver exports—roughly 121 million ounces annually—under direct Chinese government oversight. While not an outright ban, the licensing system functions as a de facto constraint on free trade, as authorities maintain discretion over approval timing and volumes. Forty-four companies received authorization for the 2026-2027 period, significantly concentrating on export control.
China's motivations reflect strategic resource nationalism amid intensifying technological competition. As the world's second-largest silver producer at approximately 109 million ounces annually (13% of global output), China also represents the dominant force in silver-intensive industries, including electronics manufacturing (70% of global production) and solar panel fabrication (90% of solar-related silver consumption). The export controls aim to secure domestic supply for China's expanding electric vehicle, renewable energy, and advanced electronics sectors while potentially leveraging silver as geopolitical currency.
The immediate market impact was severe. Following implementation, silver lease rates in London—the annual cost of borrowing physical silver—spiked above 8% on a one-month basis, indicating extreme physical tightness. The restrictions coincided with surging demand from India's festive season, creating a bidding war for available supplies. Emergency air shipments of 15-20 million ounces from U.S. warehouses and 100-150 tons from China reached London during October 2025 to alleviate the acute squeeze, demonstrating the fragility of supply chains.
The long-term implications extend beyond immediate supply constraints. China's move has prompted other producing nations to reconsider silver's strategic classification.** Russia announced a $535 million allocation over 2025-2027 to purchase precious metals, including silver, for state reserves**—marking the first explicit central bank silver accumulation program since the 1980s. The United States designated silver as a critical mineral in 2025, recognizing its essential role in renewable energy, defense systems, and semiconductor manufacturing.
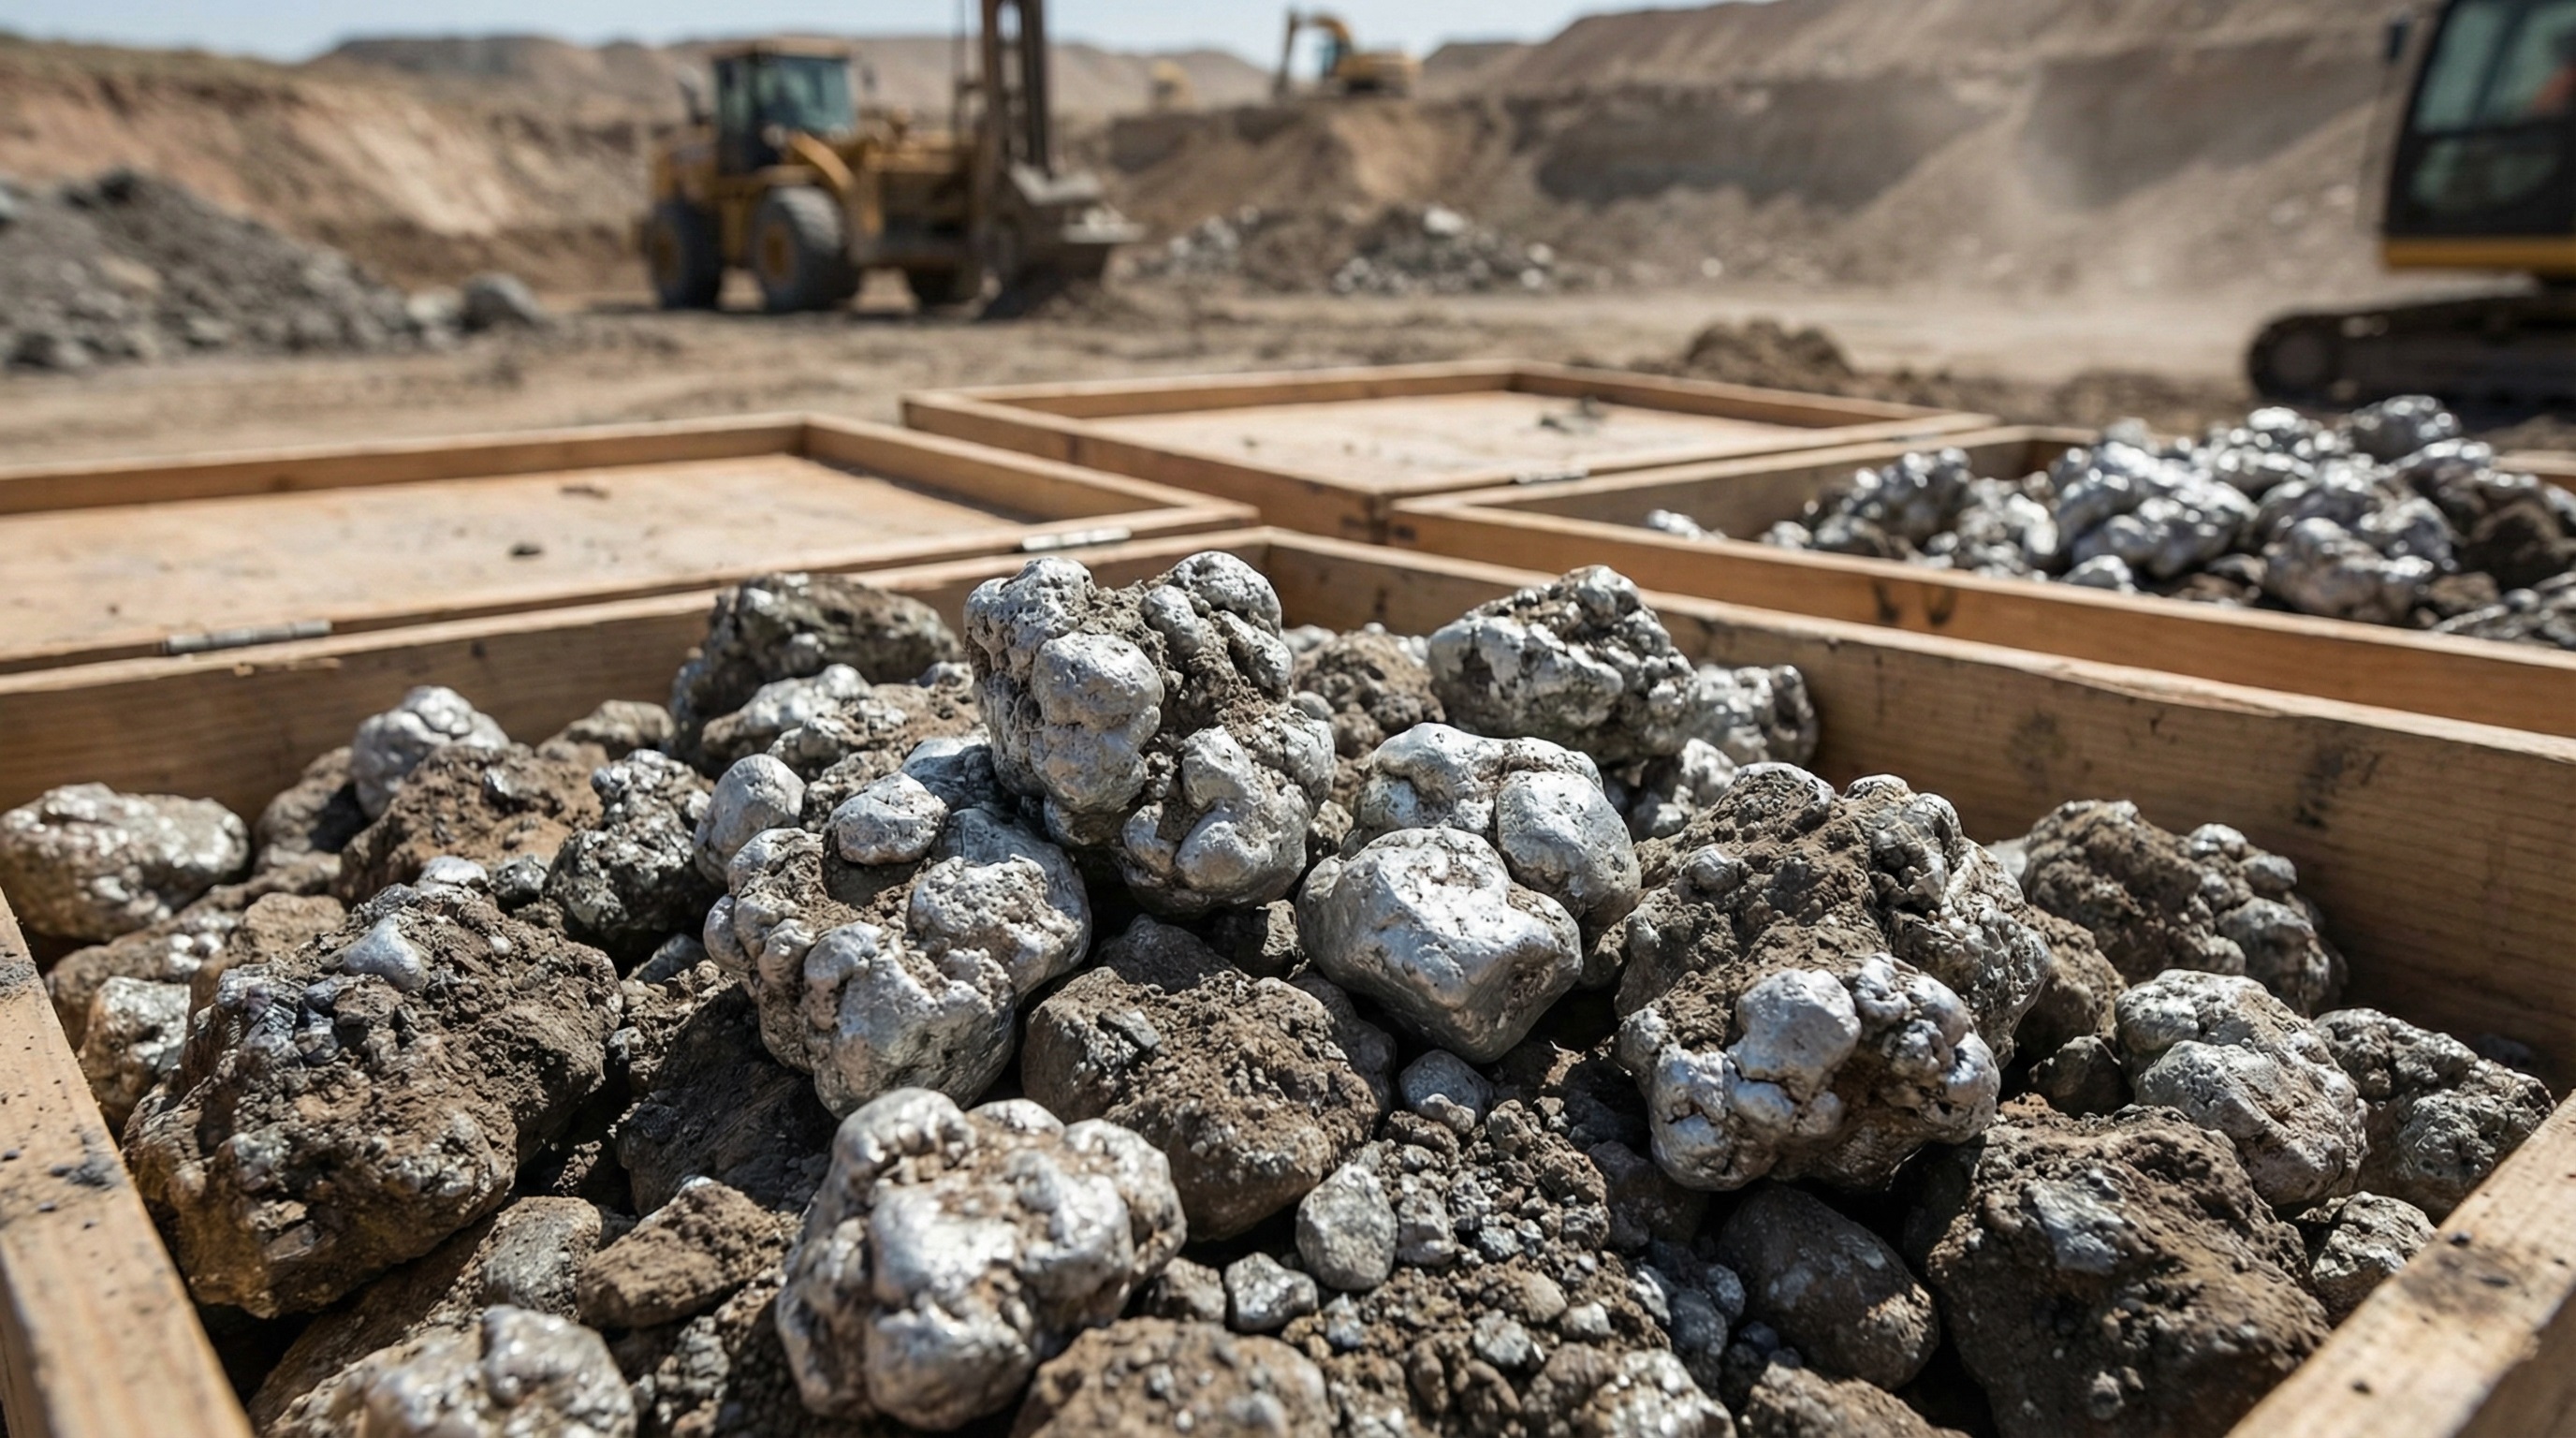
Mine Production Constraints and Byproduct Dependency
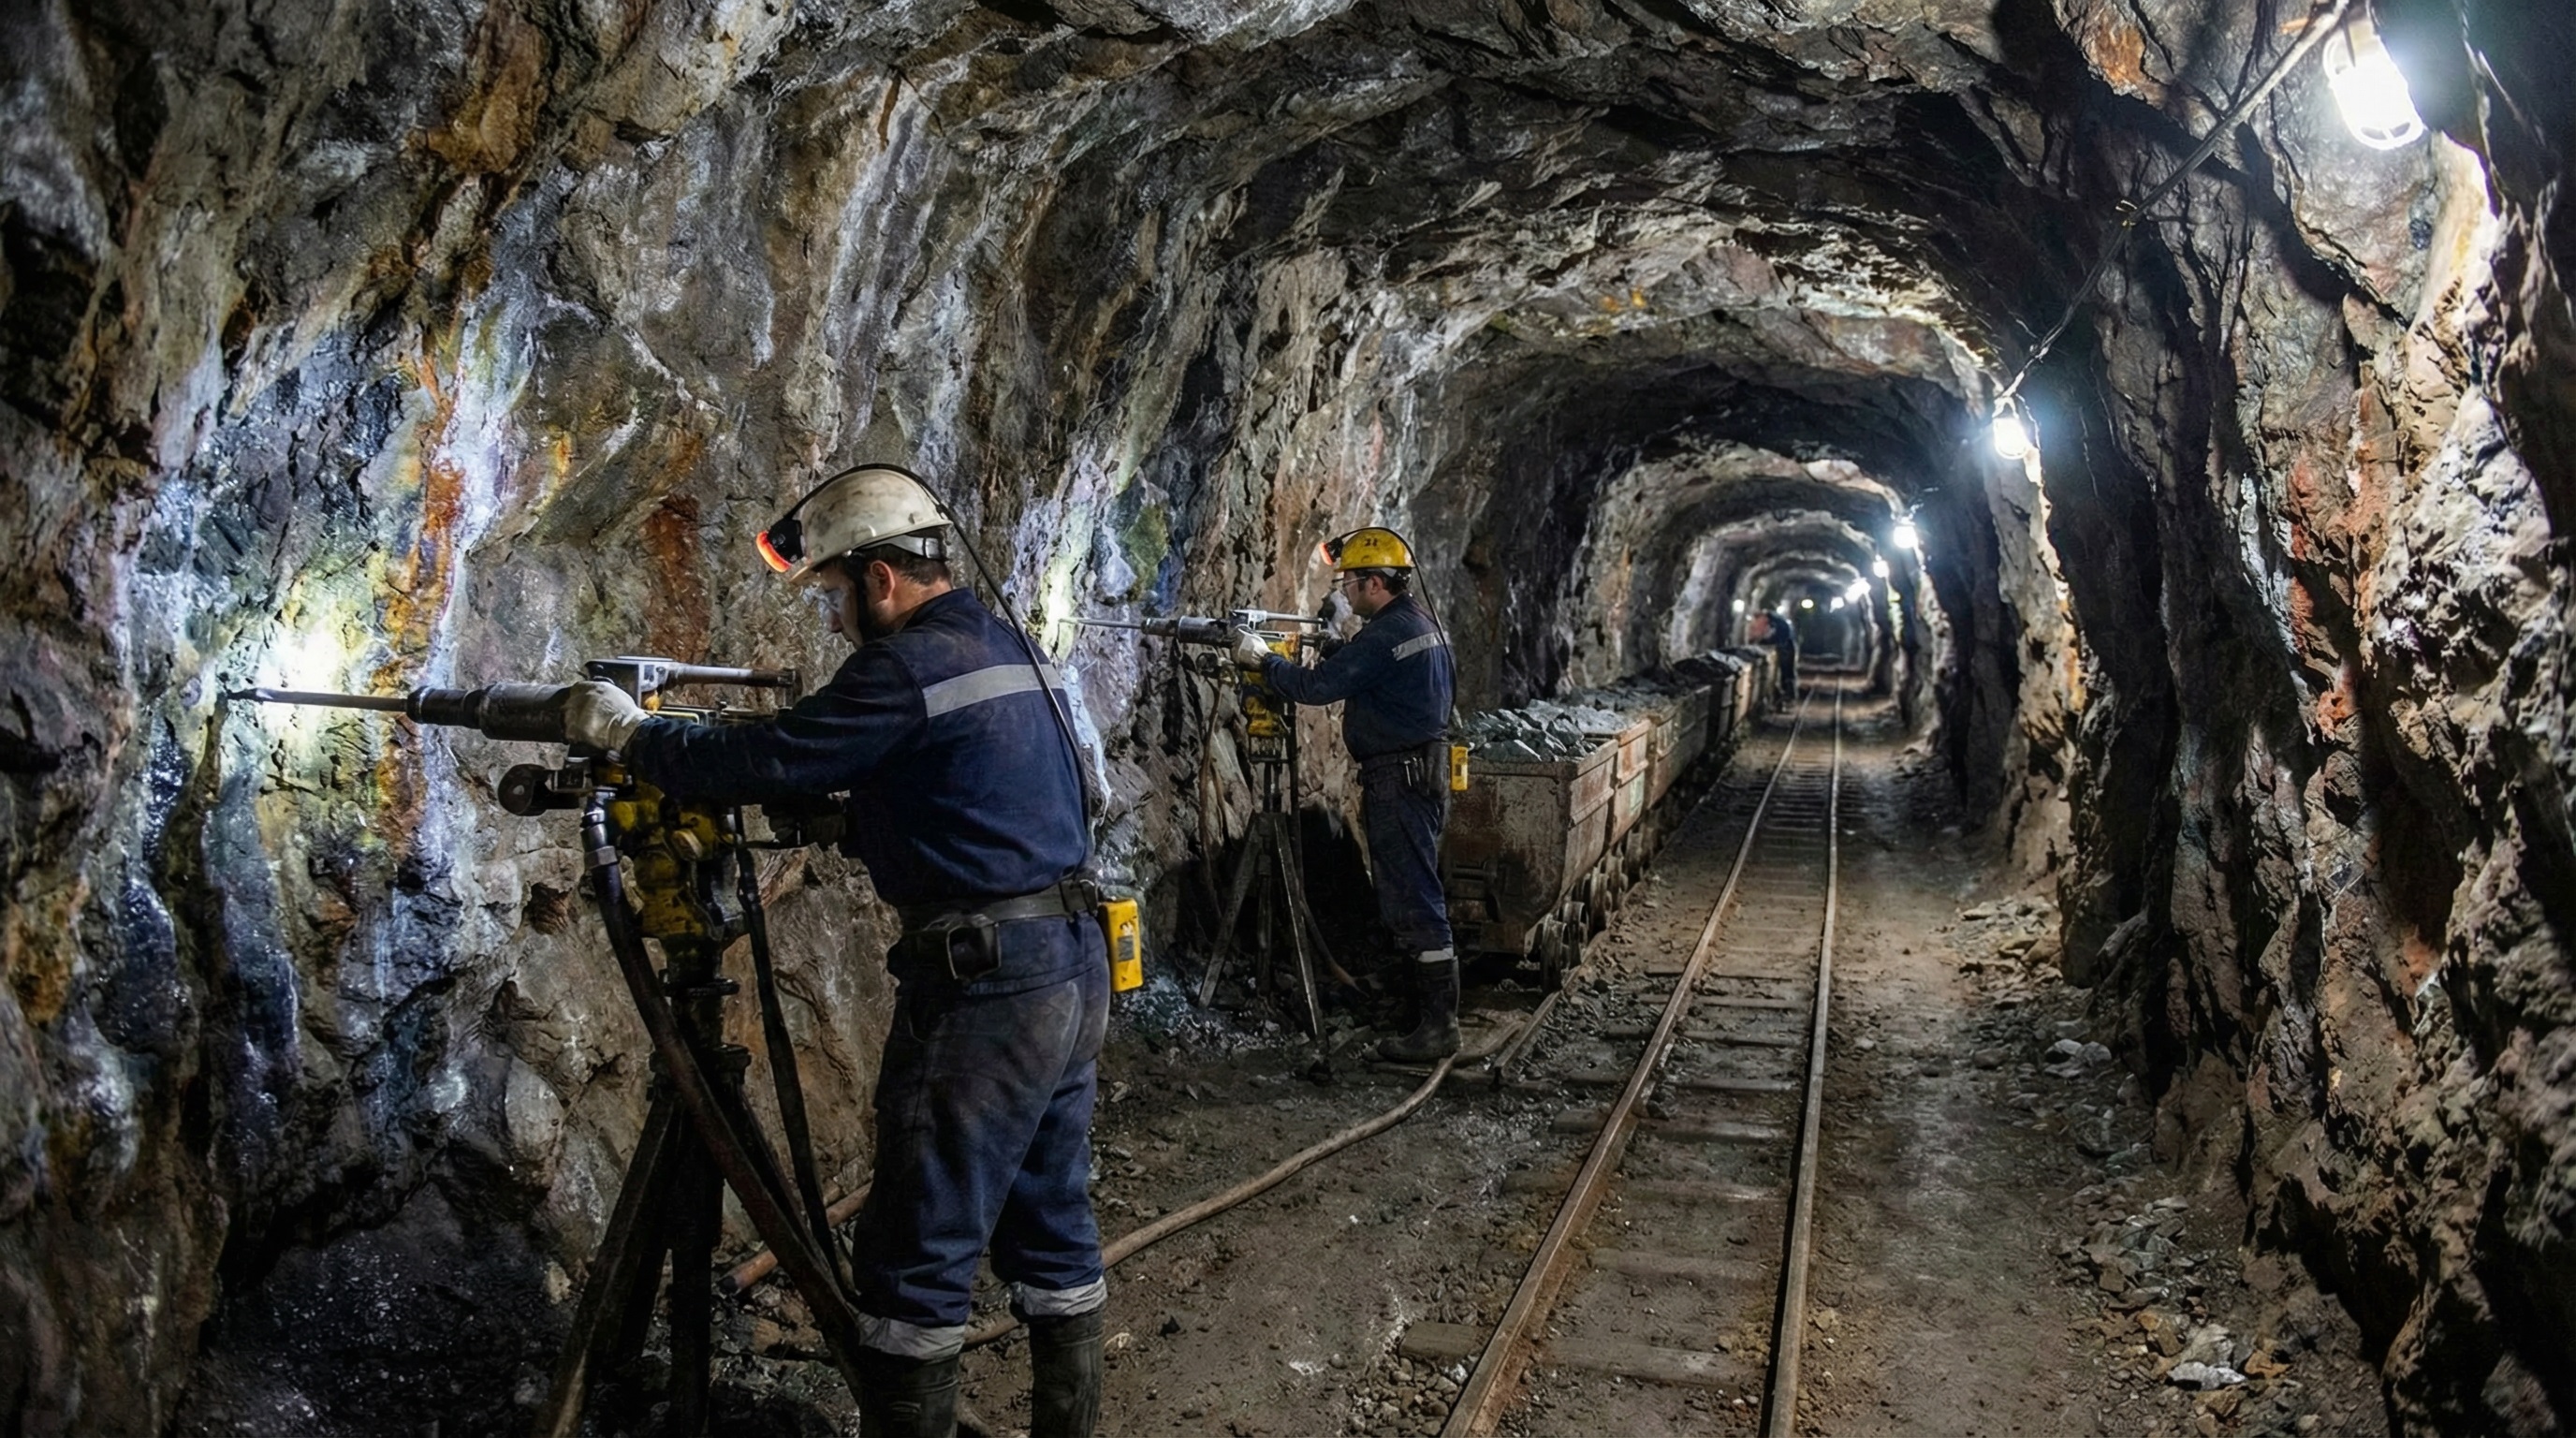
Global silver mine production has remained remarkably inelastic despite rising prices, reflecting structural constraints inherent to the metal's extraction economics. Total mined supply reached approximately 813-820 million ounces in 2025, essentially flat compared to recent years despite prices more than doubling. This supply rigidity stems from silver's predominant status as a mining byproduct rather than a primary extraction target.
Mexico dominates global silver production with 202.2 million ounces annually (24% market share), nearly double the output of second-place China at 109.3 million ounces.
Approximately 70-80% of silver production comes as a secondary output from operations primarily targeting copper, lead, zinc, and gold. Major polymetallic deposits in Peru (Antamina mine), Poland (KGHM copper operations), and Australia (Cannington lead-zinc mine) yield substantial silver volumes alongside their primary metals.
In these operations, silver production decisions are driven by base metal economics rather than silver price signals. Consequently, even when silver prices surge dramatically, producers cannot meaningfully increase output unless copper, zinc, or lead markets justify expanded operations.
Only 27% of the global silver supply comes from operations where silver constitutes the primary revenue source. Mexico's Fresnillo plc—the world's largest primary silver producer—exemplifies this category, having produced 56.3 million ounces (1,496 metric tons) in 2024 across its Mexican mining complex. Primary silver miners exhibit much greater price sensitivity, but their limited share of total output constrains the supply response to price signals.
Regional production dynamics further complicate supply responsiveness. Mexico, the dominant global producer at 202 million ounces annually (24% of world output), has experienced operational challenges, including labor strikes, declining ore grades at mature mines, and the December 2025 partial cessation at Fresnillo's San Julián facility. Peru, the third-largest producer at 107 million ounces, has struggled with social unrest, declining grades, and permitting delays that prevented production expansion despite favorable prices.
New mine development faces extended timelines and capital intensity. Environmental permitting in major producing regions often requires 5-10 years, while capital requirements for greenfield silver projects range from hundreds of millions to over $1 billion for large-scale operations. Infrastructure challenges compound development risks, particularly for remote deposits requiring significant transportation and utility investments. Water scarcity in key mining regions creates additional constraints as operations compete with agricultural and municipal demands.
The refining capacity bottleneck represents another potential constraint. Industrial applications require silver purity standards of 99.9% or higher, necessitating specialized refining facilities. Geographic concentration of refining capacity—with significant concentration in China—creates logistical pressure points during high-demand periods. The October 2025 London market squeeze partially reflected refining and logistics constraints that prevented rapid inventory replenishment despite available mined material.
Production Cost Structure
All-in sustaining costs (AISC) for silver production vary significantly depending on whether silver represents the primary or byproduct output. For primary silver operations in Mexico, major producers reported 2025-2026 guidance indicating AISC ranging from $15.75-26.00 per ounce, net of gold byproduct credits. These figures reflect direct operating costs, sustaining capital, royalties, and the impact of higher Mexican mining taxes enacted in 2025.
Specific operations demonstrate the cost range. Pan American Silver's 2026 guidance projects Silver Segment AISC of $15.75-18.25/oz across its portfolio, with individual mines spanning from the low end at Juanicipio (Mexico) to higher costs at San Vicente (Bolivia) at $41-43/oz due to elevated royalties and sustaining capital requirements. Endeavour Silver's Guanaceví and Bolañitos operations in Mexico estimate 2025 AISC at $25-26/oz, with cost increases attributed to lower production volumes as mines enter final operational years and reduced gold byproduct credits.
Cash costs—which exclude sustaining capital and represent the direct extraction and processing expenses—cluster in the $16-17/oz range for many primary operations. These figures include mining, processing (smelting, refining, transportation, and selling costs), direct overhead, royalties, and special mining duties. The direct cost structure for Mexican operations runs approximately $175-185 per tonne of ore processed, accounting for the country's increased tax burden on mining operations.
For byproduct silver from copper, lead, and zinc operations, the effective cost structure differs markedly. Since extraction occurs regardless of silver prices, the marginal cost of recovering silver approaches the incremental refining and separation expenses. This creates a constant supply stream largely independent of silver's spot price—contributing to supply inelasticity but also ensuring steady output even during periods when prices might curtail primary production.
At current prices above $100/oz, virtually all global silver production operates profitably with substantial margins. However, the high profitability has not translated to rapid supply expansion due to the structural constraints outlined above. This disconnect between pricing and supply response distinguishes silver from most commodities and perpetuates the tight market conditions supporting elevated prices.
Demand Drivers: The Industrial Revolution in Silver
Solar Photovoltaics: The Dominant Force
Solar photovoltaic panel manufacturing has emerged as the single largest driver of industrial silver demand, fundamentally transforming the metal's consumption profile over the past decade. The solar sector consumed approximately 197.6 million ounces in 2024—representing roughly 29% of industrial demand, up dramatically from just 11% in 2014. This nearly 3x increase in share reflects both the explosive growth of global solar installations and silver's irreplaceable role in photovoltaic cell metallization.
Industrial applications dominate silver demand at 59% (665 million ounces), with electronics and solar photovoltaics representing the largest industrial segments at 37% and 30%, respectively.
Silver's dominance in solar applications stems from its unmatched electrical conductivity—the lowest electrical resistance of any metal at standard temperatures. Within photovoltaic cells, silver paste forms the front-side metallization grid that collects and conducts electricity generated when sunlight strikes the semiconductor material. While substitute metals like copper have been explored, they cannot match silver's energy conversion efficiency, long-term reliability, or lifespan. Non-silver alternatives have proven less reliable and shorter-lived, presenting serious commercial deployment obstacles.
Global solar capacity expansion continues to accelerate under government climate commitments and declining installation costs. China's National Energy Administration planned to add 160 gigawatts (GW) of solar capacity in 2025 alone. The European Union targets 700 GW of total solar capacity by 2030, while India aims for 280 GW by the end of the decade. Annual panel production now exceeds 300 million units, each requiring its share of finite silver supplies.
The relationship between solar growth and silver demand has been moderated by intensive "thrifting" efforts—manufacturer initiatives to reduce silver content per panel. Through technological advances, including multi-busbar (MBB) and zero-busbar (0BB) cell designs, ultra-fine line printing techniques, and process optimizations like Laser Selective Emitter technology, manufacturers reduced silver loadings per watt by approximately 15-20% in 2025. Silver content per cell fell from 521 milligrams in 2009 to approximately 130 milligrams by 2016, then continued declining as prices rose.
Despite these efficiency gains, aggregate silver consumption in photovoltaics remains elevated and may increase depending on which solar technologies dominate future deployment. Advanced cell designs like heterojunction (HJT) and Tunnel Oxide Passivated Contact (TOPCon) actually require 15-30% more silver than conventional PERC cells, offsetting some thrifting gains. Emerging perovskite-silicon tandem cells and concentrated solar technologies may maintain or increase per-unit silver intensity.
Notably, some manufacturers are pursuing silver substitution entirely. **Leading Chinese producer LONGi Green Energy announced in January 2026 that mass production of solar cells using base metals like copper instead of silver would commence in Q2 2026. **Competitors, including Jinko Solar and Aiko Solar, have made similar commitments.
However, substitution faces significant technical hurdles related to conductivity, reliability, and long-term performance. The timeline and scale of successful commercialization remain uncertain, and silver-based cells continue dominating production through early 2026.
The net outlook for solar-related silver demand reflects competing forces. Installation growth of 10-15% annually supports consumption increases, but accelerating thrifting and potential substitution create offsetting pressures. Consensus estimates for 2026 project solar sector consumption of 200-246 million ounces—relatively flat to modest growth compared to 2024-2025 levels. This plateau represents the most significant near-term risk to silver's demand growth trajectory.
Electric Vehicles and Automotive Electrification

The automotive sector's electrification represents a rapidly expanding demand vector for silver, with electric vehicles (EVs) requiring 67-79% more silver than traditional internal combustion engine (ICE) vehicles. A typical EV incorporates 25-50 grams of silver across battery management systems, power electronics, charging infrastructure, and electrical contacts. As EV production scales toward overtaking ICE vehicles—projected to occur by 2027—automotive silver demand will experience step-change growth.
The demand increase stems from EVs' vastly greater electrical complexity. Battery management systems require silver-containing sensors, circuits, and connectors to monitor cell temperature, voltage, and current flow. Power electronics that convert DC battery power to AC for electric motors utilize silver for maximum conductivity and thermal management. Charging infrastructure—both on-vehicle and fixed installations—incorporates silver contacts and components to handle high-current flows safely and efficiently.
Beyond EVs themselves, charging station proliferation creates parallel demand. Level 3 fast-charging stations require substantial silver content in power electronics, contactors, and high-current switching equipment. As governments mandate charging infrastructure expansion—with targets like the U.S. goal of 500,000 public charging stations—this segment will contribute meaningfully to industrial silver consumption.
Next-generation battery technologies under development may significantly amplify automotive silver demand. Solid-state batteries, lithium-sulfur systems, and metal-air batteries being researched for post-2027 deployment incorporate enhanced silver content for improved conductivity and thermal management. If these technologies achieve commercial scale, they could add 50-75 million ounces to annual demand by 2030.
Grid modernization supporting EV adoption creates additional demand.** Smart grid infrastructure, renewable energy integration hardware, and advanced metering systems all utilize silver for its superior electrical and thermal properties**. The buildout of grid-scale battery storage to buffer renewable energy intermittency generates further consumption through inverters, power electronics, and control systems.
Current automotive sector silver demand approximates 90 million ounces annually. With global EV sales continuing to accelerate—particularly in China, Europe, and increasingly in North America—this segment is projected to grow at 10-15% compound annual rates through 2030, potentially exceeding 150 million ounces by decade's end under aggressive electrification scenarios.
Electronics, 5G, and Data Centers
Electronics manufacturing represents the largest single industrial application, consuming approximately 245 million ounces annually—roughly 37% of industrial demand. Silver's role as the best conductor of electricity and heat makes it indispensable across countless electronic applications: printed circuit boards, semiconductors, connectors, switches, contacts, and conductive adhesives.
China's dominance in electronics production—over 70% of global output—concentrates demand geographically. Manufacturing cycles peak in Q2 and Q3 as companies prepare for holiday season product launches, creating predictable seasonal consumption spikes. Smartphones alone account for massive silver content; every million devices recycled would yield approximately 350 kilograms of silver.
The 5G telecommunications buildout has created substantial incremental demand. 5G base stations require significantly more silver-containing components than 4G predecessors due to increased antenna arrays, power electronics, and signal processing capabilities. The rapid global deployment of 5G infrastructure—with China leading installations—has permanently elevated baseline electronics demand.
Data centers and artificial intelligence infrastructure represent the newest and fastest-growing electronics demand driver. Global IT power capacity has increased 53-fold since 2000, rising from 0.93 GW to nearly 50 GW in 2025. This 5,252% expansion translates directly into demand for servers, storage systems, networking equipment, and cooling infrastructure—all silver-intensive. Governments in the U.S., UK, and China now classify data centers as "critical infrastructure," ensuring continued investment and associated silver consumption.
AI-specific applications create particularly intense demand. High-performance computing for machine learning requires advanced thermal management solutions, specialized semiconductors, and ultra-reliable connections—applications where silver's properties are increasingly specified over alternatives. The proliferation of AI systems across industries suggests this demand vector will strengthen through the decade.
Quantum computing, while still emerging, represents a potential step-change in silver consumption. These systems require silver for thermal management, electrical performance optimization, and specialized components. As quantum systems scale toward commercial applications, they could add 10-15 million ounces annually by 2030.
Medical, Antimicrobial, and Defense Applications
Silver's antimicrobial properties drive significant medical and healthcare applications that have expanded considerably post-pandemic. Silver-coated catheters, wound dressings, surgical instruments, and medical implants are widely used to prevent bacterial colonization and reduce hospital-acquired infection rates. Research demonstrates that silver-coated medical devices significantly lower infection risk, creating structural demand from healthcare systems prioritizing hygiene and patient outcomes.
The antimicrobial properties function through silver ions, disrupting essential cellular processes in bacteria, viruses, and fungi. Unlike conventional disinfectants requiring frequent reapplication, silver-based additives provide continuous product protection over extended periods—ideal for medical devices, food packaging, textiles, and high-touch surfaces.
The silver-based antimicrobials market is projected to grow at approximately 8-9% CAGR, with healthcare and medical devices accounting for roughly 45% of total revenue in 2023. Consumer products, water treatment, antimicrobial textiles, and food packaging represent rapidly expanding segments. Germany's $500 million green-building initiative incorporates silver-infused coatings in construction materials for schools, airports, and healthcare facilities to mitigate microbial transmission.
Defense and military applications, while often under-reported in official statistics, may represent substantially greater consumption than commonly acknowledged.
Silver's uses in military applications include:
- Rockets, missiles, bombs, shells, and torpedoes
- Fighter jets and advanced aircraft avionics
- Satellites and space technology
- Radar and communications systems
- Night vision goggles and thermal imaging
- Tanks, submarines, and naval systems
- Nuclear technology applications
Silver's selection for defense applications stems from its superior electrical conductivity (critical for reliability in mission-critical systems), antimicrobial properties (important for hygiene in confined spaces), and corrosion resistance (essential for equipment exposed to harsh environments). Advanced aircraft like the F-35 utilize silver extensively in avionics and electronic systems. Silver is also critical in electromagnetic shielding for sensitive military equipment and secure communications devices, helping to prevent interference and protect against electronic threats.
Russia's allocation of $535 million over 2025-2027 for precious metals purchases—explicitly including silver—signals recognition of the metal's strategic military importance. The designation also suggests potential government silver buying that could remove substantial quantities from commercial markets. Russia's +340% increase in silver reserves year-over-year in 2025 and ongoing exploration expenditures of $454 million underscore this strategic priority.
Monetary and Investment Demand Factors
Federal Reserve Policy and Real Yields
Monetary policy dynamics have provided crucial support for silver's rally through 2025-2026, with Federal Reserve rate-cut expectations compressing real yields and enhancing the appeal of non-yielding assets like precious metals. The Fed's return to accommodative policy in 2025 after the 2022-2023 tightening cycle reduced the opportunity cost of holding silver relative to interest-bearing alternatives.
Real yields—nominal interest rates minus inflation expectations—represent gold and silver's most significant macro correlation. As central banks cut nominal rates while inflation remains elevated or sticky, real yields decline or remain negative, making precious metals relatively more attractive for portfolio allocations. The Fed's December 2025 rate cut and market expectations for at least two additional 25-basis-point cuts in 2026 have maintained this supportive environment.
The Federal Reserve’s December 9–10, 2025, meeting marked a critical inflection point for bullion markets, as investors looked for clarity on the direction of monetary policy in 2026. Market speculation that President Trump might replace Fed Chair Jerome Powell with a more dovish candidate has further bolstered bets on future rate cuts, underpinning safe-haven flows into precious metals.
Lower interest rates reduce financing costs for mining companies developing new projects and improve equity valuations through lower discount rates applied to Net Present Value calculations. Companies with strong treasury positions benefit from reduced dilution risk and enhanced negotiating leverage in capital markets as monetary conditions ease.
U.S. Dollar Weakness and Currency Debasement
The U.S. dollar's significant weakness through late 2025 and early 2026 has amplified precious metals gains, particularly for international investors. The dollar index fell nearly 1% in late January 2026 amid Trump administration tariff threats, dropping to 98.5 in a sharp reversal of dollar strength that characterized most of 2024.
Market participants are increasingly questioning the sustainability of U.S. dollar dominance in light of ballooning fiscal deficits, rising debt-to-GDP ratios, and what some analysts describe as the currency’s growing use as a geopolitical tool through sanctions and trade policies. Concerns that the "Sell America" trend—international investors divesting from U.S. assets—could undermine the structural advantages the United States derives from dollar and Treasury market centrality have driven safe-haven flows into physical assets.
Geopolitical tensions surrounding Greenland, with Trump threatening escalating tariffs on European nations refusing to facilitate U.S. acquisition of the territory, crystallized these concerns in mid-January 2026. The threats triggered sharp increases in Treasury yields (as bond prices fell) alongside dollar weakness—an unusual combination suggesting foreign investor retrenchment rather than typical flight-to-quality dynamics.
A softer dollar provides mechanical support for silver prices by making the metal more affordable for non-U.S. buyers, increasing international demand. More fundamentally, dollar weakness reflects eroding confidence in fiat currency stability—precisely the conditions that have historically driven precious metals bull markets.
Gold-Silver Ratio Compression
The gold-silver ratio—the number of silver ounces required to purchase one ounce of gold—has compressed dramatically from extreme levels, signaling silver's significant outperformance. The ratio exceeded 100:1 in April 2025, indicating silver's relative undervaluation compared to gold. By early 2026, the ratio had compressed to approximately 46-57:1, returning to levels last seen in 2013 and approaching the March 2011 low of 32:1.
This compression occurred despite gold's own impressive performance.** Gold gained 67% in 2025, yet silver surged 147%—more than doubling gold's returns**. The divergence reflects silver's dual nature as both a monetary asset and an industrial commodity, with tightening physical supply and accelerating industrial consumption creating amplified volatility.
Historical analysis reveals that silver tends to significantly outperform gold during precious metals bull markets, delivering 2-3x the percentage gains once momentum establishes. The current ratio compression suggests this pattern is playing out again, with silver's greater volatility and smaller market size magnifying price moves in both directions.
The ratio's 100+ level in April 2025 represented a major resistance zone that has formed since the early 1990s, suggesting a possible long-term trend reversal favoring silver. However, major support levels remain to be definitively crossed. A sustained move below 50:1 and eventual test of the 32:1 historical low would confirm silver's structural revaluation relative to gold.
For investors, the compressed ratio presents both opportunity and risk. If silver maintains relative strength, further compression toward 40:1 or below could drive the metal toward $150-200 even if gold consolidates. Conversely, silver's amplified volatility means any reversal would impact the white metal disproportionately, potentially re-expanding the ratio toward 70-80:1 in a correction scenario.
ETF Inflows and Retail Investment Demand
Global investment demand through ETFs, bars, and coins has surged dramatically, removing substantial physical silver from available supply and tightening markets. By mid-year 2025, 95 million ounces had flowed into silver ETFs globally—already surpassing total 2024 inflows—pushing total ETF holdings to approximately 1.13 billion ounces valued at over $40 billion at prevailing prices.
These flows represent physical silver purchases that require metal to be added to vault stocks, directly removing supply from industrial users and intensifying market tightness. In regions where ETF positions increased by more than 500 tonnes over six months in 2025, trading volumes jumped commensurately, indicating strong institutional and retail participation.
Silver ETFs delivered extraordinary 160%+ returns in 2025, significantly outperforming most asset classes and attracting momentum-driven capital. The performance drew comparisons to precious metals bull markets of past decades, with investor positioning exceeding even the 2021 "Silver Squeeze" peaks. Research from Vanda noted that "this isn't merely a surge driven by meme stocks... we are observing a structural accumulation".
**Physical bar and coin demand remained resilient despite rising prices. The United States led global retail investment, with cumulative purchases totaling 1.5 billion ounces between 2010 and 2024. **Australia emerged as the fourth-largest physical silver market, with demand surging from 3.5 million ounces in 2019 to a record 20.7 million ounces in 2022. India, Germany, and the United States together account for nearly 80% of global bar and coin demand.
Notably, Chinese consumers shifted significantly from jewelry to investment products in 2025, with manufacturers reportedly pivoting production to meet surging demand for 1-kilogram silver bars. This substitution reflects both rising silver prices, making jewelry less accessible, and growing preference for silver as a store of value amid renminbi depreciation.
The investment demand surge creates a self-reinforcing cycle. As prices rise, media attention intensifies, attracting additional buyers despite elevated valuations. However, this dynamic introduces volatility risk. If speculative positioning unwinds—triggered by profit-taking, shifting macro conditions, or policy changes—the same momentum could reverse sharply, amplifying downside moves.
Monetary policy, currency trends, and investor flows are reshaping the precious metals landscape. Speak with our expert advisors to develop a silver investment strategy aligned with your portfolio goals. Click here to book a private consultation.
The Historic Short Squeeze and Market Backwardation
London Market Paralysis
In October 2025, global silver markets experienced unprecedented dislocation when a 1,000-ton silver order placed by India triggered an immediate freeze in the London spot market. Silver lease rates—the annual cost of borrowing physical metal—instantaneously skyrocketed from 0.25% to 200% as all traders simultaneously withdrew from the market. Swiss refiner Metalor, which operates in 17 countries, announced it would not return to silver trading before January 2026, underscoring the severity of market dysfunction.
The incident crystallized mounting physical supply constraints that had been building throughout 2025. London vaults—which serve as the global hub for over-the-counter precious metals trading—found themselves critically short of deliverable metal despite holding approximately 924 million ounces on paper. The problem: roughly 60% of London stocks were allocated to silver-backed ETFs, rendering the metal spoken-for and unavailable for spot market transactions.
The tightness forced emergency measures. Between 15-20 million ounces of silver were air-freighted from U.S. warehouses to London—an expensive logistics solution typically reserved for gold due to silver's lower value-to-weight ratio. An additional 100-150 tons were sourced from China, though not all Chinese shipments reached London as India competed aggressively for available supplies during its festive season.
Shanghai Futures Exchange inventories plummeted by 249 tons in one week during October 2025, falling to 920 tons—the lowest level since May and representing the largest weekly outflow in 11 years. This dramatic drain reflected Chinese silver moving to both London and India to alleviate acute regional shortages.
By late October, the immediate pressure had eased as air shipments replenished London inventories. However, lease rates remained elevated around 6% in December 2025—far above normal levels below 1%—indicating persistent underlying tightness. The episode demonstrated the fragility of silver supply chains and the vulnerability of paper markets when physical delivery demands surge.
Futures Backwardation: A 40-Year Phenomenon Returns
The futures market structure provided perhaps the most technically significant signal of silver's supply crisis. Silver entered deep backwardation in late 2025—a condition where near-term futures contracts trade at a premium to longer-dated contracts, indicating urgent demand for immediate physical delivery. This represented the steepest futures curve inversion since 1980, when silver briefly touched $50/oz during the Hunt Brothers manipulation.

In normal markets (contango), longer-dated futures trade at premiums to spot prices, reflecting storage costs, insurance, financing charges, and the time value of holding physical metal. Backwardation inverts this relationship, signaling that buyers are willing to pay extra for silver now rather than waiting for future delivery. The phenomenon typically indicates either acute supply stress, surging physical demand, or breakdown of normal price discovery mechanisms.
By January 2026, every futures contract through late 2026 traded below the spot price, with the front-month contract commanding approximately $2.88 premium over deferred positions. This persistent backwardation across the entire curve—rather than isolated near-term tightness—indicated market expectations that physical scarcity would last for years, not months.
The backwardation carries profound implications for market structure. First, it confirms that physical spot markets have wrested price discovery from paper futures markets. Historically, COMEX futures dominated silver price setting, with spot following derivatives prices. Backwardation reverses this dynamic, forcing futures to rise toward spot as contracts approach expiry.
Second, backwardation turns short positions into existential risks for traders. As borrowing costs surge through elevated lease rates, maintaining short futures positions becomes financially untenable. Traders betting against silver face pressure from two sides: they cannot easily source metal to borrow for delivery, and they cannot afford to keep positions open due to punitive financing costs. This forces short covering—buying back futures or purchasing physical to close positions—which in turn drives prices higher in a self-reinforcing loop.
Third, persistent backwardation challenges fundamental assumptions about silver's value. The market structure essentially admits that the metal has been systematically undervalued relative to its scarcity and strategic importance. This revaluation process—driven by actual supply constraints rather than speculation—suggests** prices must rise to equilibrate supply and demand at permanently higher levels**.
Geopolitical Tensions and Safe-Haven Flows
Trump Tariff Threats and Trade War Escalation
President Trump's return to office in 2025 brought renewed trade tensions that repeatedly catalyzed safe-haven flows into precious metals. Trump's "Liberation Day" tariffs, announced April 2, 2025, imposed sweeping levies on numerous trading partners, triggering reciprocal measures and sparking global trade war fears. The uncertainty drove investors toward gold and silver as protection against potential economic disruption.
The Greenland controversy in January 2026 provided the most dramatic recent catalyst. Trump's ultimatum demanding European nations facilitate U.S. acquisition of the semi-autonomous Danish territory—backed by threats of escalating tariffs beginning February 1, 2026—generated unprecedented geopolitical risk. The threatened measures would impose 10% tariffs on eight European nations starting February 1, escalating to 25% by June 1 and remaining until Greenland's "Complete and Total purchase" is finalized.
European leaders discussed retaliatory measures, including reviving 2024 plans to levy tariffs on U.S. goods and potentially activating the EU's anti-coercion instrument. French President Emmanuel Macron reportedly urged fellow leaders toward coordinated response. The escalating tensions triggered market stress: the VIX volatility index rose toward 20—a psychological threshold indicating heightened uncertainty—while Treasury yields surged and the dollar weakened simultaneously.
Silver jumped more than 5% to fresh record highs above $94/oz on January 18-19, 2026, directly following the tariff announcements. Gold similarly spiked to new all-time peaks near $4,755/oz, demonstrating coordinated safe-haven demand. The price action reflected not just tariff concerns but deeper anxiety about potential erosion of the global financial architecture built around dollar and Treasury dominance.
Notably, Trump subsequently decided not to impose tariffs on critical minerals—including silver, which was added to the U.S. critical minerals list in 2025. This decision temporarily eased supply concerns but did not eliminate underlying geopolitical tensions driving safe-haven positioning.
Venezuela, Nigeria, and Regional Instability
Beyond U.S.-European tensions, other regional conflicts contributed to elevated geopolitical risk premiums. In December 2025, the U.S. stepped up pressure on Venezuela's oil exports, raising concerns about supply disruptions and broader regional instability. The move increased safe-haven demand for gold and silver as investors hedged against potential energy price shocks and Latin American political volatility.
Nigerian instability similarly contributed to precious metals demand as investors sought protection against African political and economic risks. While less direct than U.S.-China or U.S.-Europe tensions, the accumulation of regional conflicts worldwide creates a pervasive uncertainty that systematically drives allocations toward hard assets perceived as stores of value independent of political systems.
The cumulative effect of multiple simultaneous geopolitical flashpoints—Ukraine war, Middle East tensions, U.S.-China technology competition, Taiwan Strait concerns, North Korean provocations—maintains a persistently elevated baseline for precious metals demand. Even when individual conflicts de-escalate, the frequency and geographic dispersion of tensions prevent meaningful reduction in aggregate risk premiums.
Central Bank Actions and Reserve Diversification
Central banks purchased 1,086 tonnes of gold in 2024—the third consecutive year exceeding 1,000 tonnes. Poland alone added 90 tonnes ($7.3 billion), while numerous emerging market central banks continued accumulating gold as part of de-dollarization strategies and reserve diversification efforts. This sustained official sector buying provided structural support for gold prices, indirectly benefiting silver through the precious metals complex correlation.
Russia's decision to include silver in state reserves represented a paradigm shift in central bank behavior toward the white metal. The $535 million allocation over 2025-2027 explicitly designates silver alongside gold, platinum, and palladium for the first time since the 1980s. Given Russia's status as the eighth-largest silver producer at 38.5 million ounces annually, the decision suggests strategic intent to leverage domestic production for reserve accumulation while reducing dollar dependence.
If other central banks follow Russia's precedent, the implications for silver markets would be profound. Central banks have universally avoided silver for decades due to storage requirements (silver requires 80x more space than gold for equivalent value), industrial consumption reducing available supply, lack of liquidity infrastructure, and greater price volatility compared to gold. A shift toward even modest central bank silver accumulation—say 1-2% of reserves—would remove hundreds of millions of ounces from commercial markets, overwhelming already-tight supply-demand balances.
China's implicit accumulation through export restrictions achieves similar effects without direct central bank purchases. By constraining refined silver exports while domestic industrial demand grows, China effectively retains greater shares of both mined and recycled silver within its borders. This strategy secures supplies for strategic industries (solar, EVs, electronics, defense) while potentially positioning China to leverage silver availability as geopolitical currency.
Price Forecasts and Technical Outlook
Institutional Price Targets for 2026
Major financial institutions have substantially increased silver price targets following the metal's extraordinary 2025 performance, though projections issued at the beginning of 2026 have already been exceeded by actual market prices. Bank of America raised its 2026 silver forecast to approximately $65/oz (with potential peaks around that level), citing structural market deficits and strong industrial demand. The forecast anticipated average prices near $56.25/oz for the full year.
Goldman Sachs maintains a bullish outlook on precious metals, positioning silver to benefit from what the bank terms a “power race and supply waves.” While specific price targets were not disclosed in public materials, the firm cites robust energy-transition demand, tightening mine supply, and a supportive real-rate environment as key drivers sustaining prices through 2026.
UBS projected mid-2026 silver prices around $55/oz in November 2025 commentary, reflecting upward revisions to earlier estimates amid strong ETF inflows and fiscal-balance concerns supporting investor demand. Metals Focus forecasts silver averaging $57/oz for full-year 2026, with potential runs toward $60 later in the year. ING estimates prices averaging $55/oz in 2026, acknowledging that the pace of 2025 gains is unsustainable but expecting prices to remain well-supported.
More bullish independent analysts project substantially higher targets. Peter Schiff forecasts silver hitting $100/oz in 2026, stating, "I think $100 is a very realistic target... it could end up being quite a bit north of that". DeVere Group analysts project silver could reach $200/oz by end-2026. Prominent investor Robert Kiyosaki similarly anticipates $200 silver by 2026, emphasizing the metal as "the best and the safest" investment amid anticipated market turmoil.
The most aggressive forecast comes from macroeconomic strategist Tom Bradshaw, who predicts silver could reach $375/oz by 2028, with gold potentially hitting $9,000. Bradshaw warns that such price levels would signal not prosperity but "alarm that the fiat currency system is under enormous pressure". Mike Maloney suggests silver could spike toward "quadruple digits" when adjusted for true inflation.
As of January 27, 2026, silver trades at $111.68/oz—already well above most institutional targets and approaching the lower end of bullish independent projections. This price action suggests either forecasts issued in late 2025 substantially underestimated the supply shock intensity, or current prices reflect speculative excess vulnerable to correction.
Technical Analysis and Key Levels
From a technical perspective,** silver's January 2026 price structure shows characteristics of a parabolic trend with extended positioning. The metal broke through multiple resistance levels through 2025-2026, establishing new support zones at former resistance points. Classical pivot analysis places initial resistance at approximately $84.84, with R2 near $98.08—both of which silver has convincingly cleared**.
Current technical support zones cluster around $80-84/oz, representing the December 29, 2025, high and recent consolidation areas. This level coincides with strong accumulation and should provide meaningful buying interest on pullbacks. A sustained break below $80 would target deeper support near $72-78, aligning with the rising 50-day moving average. The 100-day simple moving average around $51.22 represents major underlying support that, if breached, would signal potential trend reversal.
On the upside, silver established a short-term target around $120/oz based on the bullish channel structure and momentum indicators. The Relative Strength Index (RSI) shows moderate buying pressure rather than extreme overbought conditions, suggesting room for further advance before technical exhaustion signals emerge.
The medium-term technical bias remains bullish, provided trading stays above $80 support, with structural industrial demand and persistent supply deficits supporting continued upside. However, the distance from long-term moving averages has become extreme. Gold, silver's closely correlated counterpart, currently trades approximately 20% above its 200-day exponential moving average—a degree of extension that historically precedes significant corrections.
Chart patterns suggest silver is forming a potential blow-off top formation, characterized by near-vertical price advances, expanding volatility, and heavy speculative participation. Such formations typically resolve through either extended consolidation (time correction) or sharp price retracements (price correction). The specific trigger and timing remain unpredictable, but the technical structure increasingly favors defensive positioning for traders while long-term investors might view pullbacks as accumulation opportunities.
Scenario Analysis: Bull, Base, and Bear Cases
Bull Case ($120-200+ range):* *The optimistic scenario envisions silver extending gains toward $120-200/oz through 2026, driven by deepening supply deficits, accelerating industrial demand, and sustained safe-haven flows. In this scenario, China's export restrictions prove more binding than anticipated, solar demand exceeds expectations despite thrifting, and additional nations follow Russia's lead in accumulating silver reserves.
The gold-silver ratio compresses further toward 40:1, amplifying silver's outperformance. Central banks meaningfully increase silver allocations, removing substantial supply from commercial markets. Technical momentum remains constructive with corrections limited to 10-15% before buyers re-emerge aggressively.
The bull case probability increases if: geopolitical tensions escalate further, the Federal Reserve delivers more rate cuts than currently expected (3+), inflation proves stickier than forecasts, solar substitution efforts fail, or face delays, and/or additional supply disruptions occur (labor strikes, permitting delays, weather events affecting major producing regions).
Base Case ($70-100 range): The base-case scenario envisions silver consolidating recent gains amid intermittent volatility, forming a new trading range between $70 and $100 per ounce. While industrial demand remains solid, growth begins to taper as accelerated solar thrifting and limited success in substitution efforts start to temper forward momentum. Supply gradually adjusts higher as elevated prices incentivize marginal production and recycling rates improve. Investment demand fluctuates with speculative positioning unwinding during corrections but returning on dips as structural supply constraints prevent sustained price collapse. The gold-silver ratio stabilizes around 50-55:1.
This outcome assumes: global economic growth remains moderate without recession, geopolitical tensions persist but don't escalate dramatically, solar manufacturers successfully reduce silver intensity by 15-20% over 2-3 years while installations continue growing, modest new mine supply comes online (2-3% annual growth), and monetary policy normalizes gradually without extreme moves in either direction.
Bear Case ($50-70 range):** The pessimistic scenario envisions a sharp correction from current elevated levels toward $50-70/oz driven by demand destruction, speculative unwinding, and improved supply**. Solar substitution proves more successful and rapid than expected, with copper-based cells gaining meaningful market share by late 2026. A stronger U.S. dollar and rising real yields, as the Fed pauses or reverses rate cuts, reduce the appeal of precious metals.
Global economic slowdown depresses electronics and EV demand. China relaxes export restrictions as the domestic solar sector moderates. Speculative long positions unwind in a cascade, amplifying downside momentum. The gold-silver ratio re-expands toward 70-80:1.
The bear case becomes more probable if: the Trump administration negotiates major trade deals reducing tariff threats, inflation falls sharply, enabling Fed policy tightening, global recession materializes, depressing industrial demand, technological breakthroughs enable rapid silver substitution, and/or major new mine projects come online faster than expected.
Each scenario carries meaningful probability, creating elevated two-directional volatility.
Silver's amplified beta compared to gold means percentage moves—both up and down—will likely exceed the yellow metal's fluctuations. Risk management through position sizing, diversification, and disciplined profit-taking becomes critical in this environment.
Risks and Headwinds
Substitution and Thrifting Acceleration
The most significant structural threat to silver's demand growth stems from manufacturers' intensifying efforts to reduce or eliminate silver content in key applications. Solar panel producers, facing silver prices that have more than tripled, have accelerated thrifting initiatives that reduced per-watt silver loading by 15-20% in 2025. Multi-busbar, zero-busbar, and ultra-fine line printing technologies enable narrower conductor widths while maintaining electrical performance.
Beyond incremental thrifting, outright substitution poses existential risk to solar-related silver demand.** Leading Chinese manufacturers LONGi, Jinko Solar, and Aiko Solar have announced plans for mass production of copper-based solar cells beginning in 2026, with initial capacities measured in gigawatts**. If successful commercially, these technologies could displace significant portions of silver-intensive conventional cells within 2-3 years.
The substitution challenge extends beyond solar. Electronics manufacturers continuously explore silver alternatives—particularly copper—for applications where conductivity requirements can be met at lower thresholds. Advanced materials research investigates graphene, carbon nanotubes, and other novel conductors that might eventually challenge silver's dominance in specific niches.
However, substitution faces substantial technical barriers. Silver possesses the lowest electrical resistance of any metal at standard temperatures—a fundamental physical property that cannot be replicated. Alternative materials typically sacrifice energy conversion efficiency, long-term reliability, or operational lifespan. These trade-offs limit substitution to applications where performance compromises are acceptable or where hybrid solutions (silver plus substitutes) can optimize cost-performance ratios.
The historical track record suggests substitution proceeds gradually rather than disruptively. Thrifting reduced silver content per solar cell from 521 milligrams in 2009 to 130 milligrams by 2016—a significant improvement—yet aggregate solar sector silver demand grew dramatically over the same period as installation volumes overwhelmed efficiency gains. The question becomes whether volume growth can continue offsetting per-unit reductions, or if technological breakthroughs enable more rapid displacement than historical precedent suggests.
Demand Destruction and Economic Slowdown
Silver's substantial price appreciation creates inherent risks of demand destruction, particularly in price-sensitive applications. Jewelry demand—which represented 208.7 million ounces in 2024—has shown vulnerability to elevated prices. Indian jewelry fabrication, while resilient in 2024-2025 due to gold price differentials and import duty cuts, could retreat if silver sustains prices above $100/oz for extended periods.
Industrial applications exhibit varying price elasticity. Electronics and automotive manufacturers typically absorb precious metals cost increases through minor finished product price adjustments, as silver represents small fractions of total production costs. A smartphone or EV costing thousands of dollars can absorb $5-10 in additional silver expense without materially impacting demand. However, smaller-margin applications face greater sensitivity, potentially reducing silver specifications where feasible.
Broader economic slowdown poses more systemic demand risk.** Global recession would depress electronics production, automotive sales (including EVs), solar installations (as credit tightens and renewable energy investments decline), and industrial activity generally**. The 2008-2009 financial crisis demonstrated that even structurally supported commodities experience sharp demand contractions during severe recessions.
Leading economic indicators through late 2025 and early 2026 show mixed signals. U.S. labor markets remain relatively healthy, but manufacturing surveys suggest slowing activity. China’s economy continues to grapple with deep-rooted structural challenges, including persistent stress in the real estate sector and subdued consumer confidence. European growth continues to stagnate, and escalating tariffs risk tipping advanced economies into recession, pressuring demand for industrial metals like silver.
The safe-haven and investment demand components could partially offset industrial weakness during slowdown scenarios. Historical patterns show precious metals performing well during early recession phases as investors seek capital preservation, then correcting as liquidity needs force selling. Silver's dual nature creates complex dynamics where monetary demand supports prices while industrial demand contracts.
Speculative Excess and Positioning Unwind
Current silver positioning shows characteristics of speculative excess vulnerable to sharp reversal. ETF inflows, retail buying surges, and leverage in futures markets have driven prices well beyond levels justified by spot physical supply-demand fundamentals alone. Vanda Research noted that current accumulation exceeds even the 2021 "Silver Squeeze" peaks—a period that ended with a sharp correction.
Leverage in silver futures markets amplifies both upside and downside moves. While precise positioning data fluctuates daily, periods of extreme net-long positioning by speculators historically precede corrections as the marginal buyer becomes exhausted. When speculative longs begin taking profits, the absence of incremental buyers creates air pockets where prices fall rapidly until physical buyers or longer-term investors emerge.
The blow-off rally characteristics evident in silver's January 2026 price action—near-vertical advances, parabolic acceleration, breathless media coverage—typically resolve through sharp retracements. Historical analogs include silver's 1980 spike to $50 (followed by a decade-plus bear market), 2011 peak near $49 (followed by 70% decline to $14 by 2015), and numerous smaller spikes that reversed 20-40% within months.
Social media and retail trading platforms have democratized commodity speculation, potentially increasing volatility. While broader participation adds liquidity during rallies, it also introduces the risk of coordinated selling during reversals as algorithmic trading, stop-losses, and margin calls cascade. The speed of information dissemination means sentiment can shift dramatically within hours rather than days or weeks.
Identifying the precise top in speculative manias remains impossible. However, risk management dictates caution when prices exceed bullish forecasts by 50-100%, volatility reaches extreme levels, and positioning data shows crowded long exposure. Disciplined profit-taking, position scaling, and deployment of protective options strategies become prudent as parabolic moves mature.
Geopolitical De-escalation and Dollar Strength
The current elevated price regime depends partially on sustained geopolitical tensions and dollar weakness. Should major trade agreements emerge, military conflicts de-escalate, or political uncertainties resolve, the safe-haven premium could rapidly evaporate. Trump administration trade negotiations with China, Europe, or other partners might produce deals reducing tariff threats and easing growth concerns.
A period of dollar strength—driven by relative economic outperformance, higher U.S. real yields, or flight-to-quality during global stress—would mechanically pressure silver prices. The inverse correlation between the dollar and precious metals has been consistent historically, though not absolute. A 5-10% dollar rally could subtract $15-25/oz from silver prices through currency effects alone, potentially triggering technical selling that amplifies the move.
Federal Reserve policy shifts present two-sided risk. If inflation proves more persistent than expected, forcing the Fed to maintain or increase interest rates, real yields could rise substantially. Higher real yields increase the opportunity cost of holding non-yielding assets, potentially triggering precious metals selling despite ongoing supply deficits. Conversely, if the Fed delivers more aggressive cuts due to recession fears, this would support metals prices but likely coincide with industrial demand weakness—creating cross-currents.
Silver's Strategic Importance: A Paradigm Shift
From Monetary Asset to Critical Industrial Commodity
Silver's remarkable price ascent reflects a fundamental revaluation of the metal's role in the global economy. For decades, silver occupied an awkward middle ground—less prestigious than gold as a monetary metal, yet not exclusively industrial like copper or aluminum. This ambiguous status contributed to chronic undervaluation relative to supply constraints and industrial essentiality.
The 2025-2026 rally has crystallized silver's transformation into a strategic industrial commodity with critical national security implications. The U.S. Geological Survey's designation of silver as a critical mineral in 2025 marked a paradigm shift, acknowledging the metal's irreplaceable role in renewable energy, defense systems, semiconductor manufacturing, and advanced technologies. This classification places silver alongside rare earth elements, lithium, cobalt, and other materials deemed essential to economic competitiveness and military capability.
The strategic importance stems from three interconnected factors: supply vulnerability (the U.S. imports approximately 67% of consumption), industrial applications powering the green transition and technological advancement, and national security uses across defense systems and communications equipment. Modern military capabilities from missile guidance to satellite communications rely heavily on silver's superior electrical and thermal properties.
China's export licensing system and Russia's reserve accumulation underscore silver's elevation to strategic resource status. Nations increasingly view silver through the lens of resource security and technological competition rather than purely commercial commodity markets. This shift suggests that even if prices moderate from current highs, structural floors have likely been established far above historical ranges.
Implications for Supply Chains and Industries
Industries dependent on silver face profound challenges adapting to the new price regime. Solar panel manufacturers operating on thin margins have seen materials costs surge, compressing profitability and forcing difficult choices between accepting reduced margins, raising panel prices (potentially reducing installation volumes), or accelerating substitution efforts. The tension between climate policy goals requiring massive solar deployment and silver's constrained supply creates potential bottlenecks for energy transition timelines.
Electronics manufacturers face similar pressures, though typically with greater ability to pass costs through supply chains given silver's relatively small share of total production costs. More concerning are potential supply disruptions if physical tightness returns to levels seen in October 2025. Production shutdowns due to materials unavailability would prove far costlier than elevated materials prices.
The automotive sector's electrification trajectory depends significantly on silver availability at manageable costs. If supply constraints force rationing or allocation systems, EV production might face unexpected headwinds despite strong consumer demand and government support. This could slow climate transition progress and alter competitive dynamics among automakers based on their supply chain resilience.
Governments and industries are responding through multiple channels: increased recycling efforts (particularly from electronic waste), exploration for new primary silver deposits in politically stable jurisdictions, research into substitution technologies, and in some cases, strategic stockpiling. The U.S. critical minerals designation potentially enables domestic production subsidies, accelerated permitting, and government purchases for strategic reserves.
The recycling opportunity is substantial but faces challenges. Every million smartphones recycled yields approximately 350 kilograms of silver, while one million circuit boards can produce up to 800 grams of gold alongside silver. However, global e-waste recycling rates remain low at 22-25%, with most of the 62 million tonnes generated annually in 2025 ending in landfills or informal processing. Scaling formal recycling could add 30-50 million ounces to annual supply if recovery rates doubled, providing a meaningful offset to deficits.
Conclusion: The Silver Rally and a Market at a Critical Juncture
Silver's extraordinary 270% surge from January 2025 to January 2026 represents one of the most dramatic commodity repricing events in modern financial history. The rally reflects a confluence of structural supply deficits, surging industrial demand, geopolitical stress, shifting monetary policy, and tightening physical markets—evident in historic short squeezes and persistent futures backwardation.
The fundamental drivers supporting elevated prices remain largely intact as of early 2026. Five consecutive years of supply deficits totaling over 820 million ounces have depleted freely tradable inventories to critically low levels. China's export licensing system has removed 60-70% of refined silver from open global trade, creating structural supply constraints independent of price signals. Industrial demand from solar, EVs, electronics, and defense applications continues growing despite manufacturers' thrifting efforts.
However, silver has reached prices that challenge both technical and fundamental sustainability. Current levels at $111.68/oz exceed even bullish institutional forecasts by 50-100%. Speculative positioning appears extended, with ETF holdings, retail buying, and futures leverage at levels historically associated with market tops. The metal trades approximately 100% above its 200-day moving average—a degree of extension that typically precedes significant mean reversion.
The path forward likely involves elevated volatility as bull and bear forces contest appropriate valuation.** Bullish scenarios envision silver extending toward $120-200+** if supply disruptions deepen, central bank buying accelerates, or geopolitical tensions escalate. **Bearish scenarios anticipate a correction toward $50-70 **if demand destruction materializes, substitution accelerates, or speculative excess unwinds. Base case outcomes cluster around $70-100 consolidation as markets digest recent gains and reassess sustainable equilibrium levels.
For investors, silver offers compelling long-term fundamentals balanced against significant near-term technical risk. The energy transition, electrification, digitalization, and green technology revolution ensure structural demand growth over the coming decade. Supply constraints rooted in byproduct dependence and long mine development timelines prevent rapid production responses. These forces suggest silver's secular bull market likely has years to run.
Yet parabolic rallies rarely end gently. Investors should expect sharp corrections—potentially 20-40% from peaks—even within longer-term bull markets. Disciplined risk management through position sizing, profit-taking at euphoric extremes, and strategic reallocation during fearful corrections will differentiate successful participants from those caught in reversals.
Silver has decisively broken free of its decades-long suppression, emerging as a critical strategic commodity essential for technological progress and national security. Whether prices consolidate, correct, or extend higher in the coming months, the metal's fundamental revaluation appears permanent. The era of $20-30 silver supported primarily by monetary considerations has ended, replaced by a new regime where $60-100 levels reflect silver's genuine scarcity and industrial indispensability in the 21st-century economy.
For personalised guidance based on your objectives and risk profile, book a private consultation with our precious metals specialist team.** Our experts will help you position your portfolio to take advantage of current market opportunities.**
This article is for general information only and does not constitute financial, legal or tax advice. Rules, prices and regulations change; verify current requirements with a qualified adviser before acting.