How to Position Capital in a Post-Conflict Economy as Markets Recover
- Neil Robbirt

- 3 hours ago
- 9 min read

The pattern in the data is unusually consistent. Across twenty major military conflicts in the post-1945 period, the S&P 500 has fallen an average of 6% from initial impact to trough, and recovered to pre-conflict levels in an average of 28 days. The 2026 Iran conflict has tracked that pattern almost exactly.
The index bottomed in mid-March, the ceasefire took hold in early April, the Strait of Hormuz reopened on 17 April, and US equities had fully erased their losses by mid-April. The market has, in a narrow sense, "moved on."
The post-conflict environment for capital is not the same as the pre-conflict environment, however, and treating it as such is the most common mistake investors make once the headlines fade.
Two structural shifts have already taken hold. The first is a sustained energy price premium and the inflation, currency, and rate consequences that follow it. The second is a $588 billion Ukraine reconstruction programme, a Syrian transition, a Gaza reconstruction process, and a Middle East rebuild bill that together represent the largest concentration of post-conflict reconstruction capital required since the Marshall Plan.
For investors, the question is not whether markets recover — they have, repeatedly, and they have done so this time. The question is where capital should be deployed now, given that the post-conflict landscape contains a narrow set of genuine opportunities and a much larger set of value traps that look attractive only on the surface.
This piece examines what historical post-conflict recoveries actually look like, how the 2026 environment fits the pattern, which sectors and regions are absorbing the largest reconstruction flows, and how to apply capital selectivity in an environment where the easy buying may already have happened.
Speak with our team to review how reconstruction and post-conflict opportunities fit within your broader portfolio.
The Historical Pattern of Market Recoveries
The starting point for any post-conflict investment thinking is understanding what the data actually shows, because the popular narrative tends to overstate both the depth of the drawdown and the speed of the recovery.
The averages are deceptive. In 20 major post-World War II conflicts, the S&P 500 fell 6% on average and recovered in 28 days. But the distribution around that average is what matters. The 1967 Six-Day War saw a 1.5% decline. The 1973 Yom Kippur War and Arab oil embargo produced a 16.1% drawdown and a multi-year malaise that did not fully resolve until the early 1980s. The 1990 Iraqi invasion of Kuwait drove a 15.9% drawdown and a six-month recovery, followed by a 20% rally in the six months after the ceasefire. The 2003 Iraq War invasion was followed by a 26.7% S&P gain in the first 12 months.
The variable that separates a quick V-shaped recovery from a multi-year malaise is not the conflict itself. It is whether the conflict triggers a sustained energy price shock and whether central banks face a stagflationary dilemma as a result.
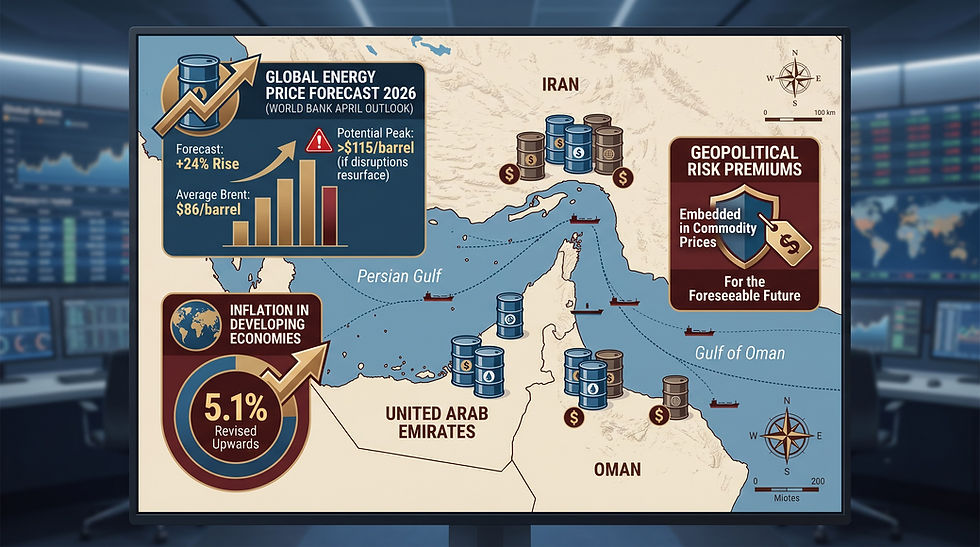
The 2026 Iran conflict produced exactly that energy shock, with Brent up 63% in March alone. The market's rapid V-shaped recovery reflects three things: the ceasefire arrived sooner than feared, the Strait of Hormuz reopened on 17 April, and underlying corporate earnings have held up — Q1 2026 S&P earnings rose 12.6% year-on-year.
None of that means the inflationary consequences have unwound. The 10-year US Treasury yield is meaningfully higher than before the conflict began, Fed rate cut expectations for 2026 have vanished, and the World Bank's April Commodity Markets Outlook projects energy prices to rise 24% in 2026.
The lesson from history is that the post-shock period is when capital selectivity matters most. The averages flatter the easy recoveries and disguise the periods in which broad equity exposure underperformed for years. Knowing which environment you are in is the first investment decision.
The 2026 Environment in Context

The IMF's April 2026 World Economic Outlook frames the current period bluntly. Global growth is projected at 3.1% in 2026 and 3.2% in 2027, below recent outcomes and well under pre-pandemic averages. Inflation will tick up in 2026 before resuming its decline in 2027. Pressures are concentrated in emerging markets and developing economies, particularly commodity importers with pre-existing vulnerabilities.
The IMF's chapter on conflict economics, drawing on global data from post-1945 wars, is more direct. Armed conflicts generate large and persistent output losses in economies where fighting occurs, exceeding the losses from financial crises or severe natural disasters. Recoveries are slow and uneven, depend critically on sustained peace, and even when peace holds, are led primarily by labour rather than capital and productivity, which remain subdued for extended periods.
The practical takeaway is that two parallel investment environments now exist:
Developed markets, which absorbed the shock, repriced energy and rates, and have moved into a higher-volatility, lower-real-return regime. Capital here needs to be selective on duration, on sector, and on the durability of corporate cash flow under structurally higher input costs
Conflict-affected and post-conflict economies, which face multi-year reconstruction needs, partial recoveries, and the highest dispersion between winning and losing sectors or asset choices of any environment in the global economy
Most investors hold capital in the first environment and are now being offered access to the second. Both warrant analysis, but the frameworks for evaluating them are completely different.
The Reconstruction Capital Map
The scale of what needs to be financed is worth stating directly, because it shapes every conversation about post-conflict allocation.
Region | Estimated reconstruction need | Primary capital sources | Realistic timeline |
Ukraine | $588 billion over 10 years (World Bank RDNA5, February 2026) | EU Macro-Financial Assistance €18.1bn, EU loan €90bn 2026-27, IMF EFF, World Bank, MIGA, private capital | Recovery contingent on sustained peace; selective FDI now, broader inflows 2027-2030 |
Syria | Estimated $400-500 billion pre-reconstruction; phased EU and Gulf engagement underway | Gulf states (UAE, Saudi Arabia, Qatar), EU, conditional Western re-engagement | Early stage; depends on governance stability |
Gaza | $50-80 billion estimated | Gulf states, EU, World Bank; politically constrained | Multi-year; structural questions unresolved |
Iran-affected Gulf infrastructure | Tens of billions in deferred capex, port and refining upgrades | Sovereign budgets, private capital | Already underway as Strait reopening confirms continuity |
The total is north of $1 trillion in capital required over the coming decade, which is approximately 60% of the Marshall Plan's inflation-adjusted scale concentrated in a much smaller geographic footprint.
Not all of this will be financed, and the proportion that flows through private rather than public channels remains uncertain. But the scale alone makes reconstruction a structural rather than cyclical theme.
The IMF's research on conflict recoveries flags an important constraint. Post-conflict FDI typically remains subdued in the short term, becomes selective in the medium term, and only broadens once security conditions stabilise and reforms in privatisation, governance, and capital markets advance.
Ukraine's experience is illustrative — total FDI inflows since 2022 have been $8.3 billion, with roughly three-quarters of 2023 inflows consisting of reinvested earnings from existing multinationals rather than fresh capital. The flows follow the institutions, not the headlines.
Sectors Where Capital Is Actually Going
The reconstruction story breaks down into a relatively narrow set of sectors where capital is genuinely being deployed and where private investors can realistically participate.
Defence and dual-use technology has become the clearest single beneficiary. Ukraine's defence industry alone is projected to reach $50 billion in production capacity by the end of 2026, with strong dual-use applications in drones, electronic warfare, demining robotics, and AI-driven logistics. NATO commitments, Asia-Pacific re-armament, and the structural shift in government spending priorities have put global defence procurement on a multi-year upward trajectory. Listed names from Lockheed Martin and RTX to BAE Systems and Rheinmetall have re-rated meaningfully through 2025-2026, and the runway extends well beyond the immediate conflict.
Energy infrastructure and transition sits at the intersection of reconstruction needs and the broader supply chain regionalisation that the 2026 shock accelerated. Ukraine alone requires energy grid modernisation at a scale the European Commission estimates at a sustained 14% GDP-equivalent annual investment for five years. Globally, the case for LNG export capacity, transmission infrastructure, and grid-scale storage has strengthened with every disruption to traditional supply chains.
Transport and logistics infrastructure follows the same pattern. Rail modernisation to EU standard gauge, port upgrades, and corridor connectivity across Ukraine, the Black Sea, and Central Europe represent a multi-decade programme. Container shipping, port operators, and integrated logistics names benefit from the regionalisation of supply chains regardless of whether reconstruction proceeds at the pace officially planned.
Critical minerals and processing capacity is the input layer underneath all of the above. The reconstruction theme, the AI capex cycle, the defence build-out, and the energy transition all draw on the same resource base. Copper, lithium, rare earths, and uranium have re-rated for structural rather than cyclical reasons, and the underinvestment in processing capacity outside China is now a stated policy priority across the EU, US, and Japan.
Financial guarantees and de-risking instruments are less visible but increasingly important. The EU's Ukraine Investment Framework, the Multilateral Investment Guarantee Agency (MIGA), and emerging blended finance structures from the EBRD and IFC are designed specifically to bridge the gap between public risk tolerance and private return requirements. For sophisticated investors, exposure here can come through institutional credit funds, listed development finance vehicles, and increasingly through tokenised infrastructure debt.
What is conspicuously not on this list — and where most retail-facing reconstruction marketing concentrates — is direct equity exposure to conflict-zone real estate, frontier-market currencies, or local-listed reconstruction companies. The volatility and governance risks in these areas remain materially mispriced relative to the alternatives above.
What Capital Selectivity Actually Looks Like in a Post-Conflict Economy

The phrase "capital selectivity" gets used loosely in post-conflict commentary, but it has a specific meaning that matters for portfolio construction.
In a normal cycle, broad market exposure captures most of the available return. In a post-conflict environment, the dispersion between winners and losers within the same sector, country, and asset class is unusually wide. Energy stocks rose 12% in March 2026, while consumer staples and healthcare fell 9% and 8%, respectively.
Within energy, half of the S&P energy ETF holdings lagged the headline rally. Within reconstruction-themed equities, the gap between names with credible contracts and those marketed primarily on the theme is wide enough to drive multi-year underperformance for the latter group.
Selectivity in this environment means six things in practice:
Prioritise cash flow over story. Reconstruction-themed names with no contracts and no near-term revenue should be evaluated as venture capital, not as listed equity
Favour structures with regulatory protection. MIGA guarantees, EU-backed instruments, and IMF-anchored programmes carry meaningful credit enhancement that retail-marketed alternatives do not
Discount returns for governance risk. A 15% projected return in a jurisdiction with unresolved property rights is not equivalent to a 15% return in a Tier 1 jurisdiction
Stage capital deployment. Reconstruction timelines are measured in years and decades, not quarters. Phased deployment, as conditions verify, is materially better than concentrated allocation at the headline moment
Hold the inflation hedge. Gold, real assets, and selective commodity exposure remain structurally important given the energy price reset that has not unwound
Avoid concentration in single jurisdictions. Even credible reconstruction stories carry conflict-resumption risk; diversified exposure across regions and sectors is the only defensible single-portfolio approach
For tailored guidance on integrating reconstruction and post-conflict exposure into your broader portfolio, schedule a consultation with our experts.
Three Scenarios for the Rest of 2026
The path from here depends on three variables — whether the Iran ceasefire holds, whether Ukraine moves to a structured peace, and whether the inflation regime stabilises or re-accelerates. Holding three scenarios in mind is more useful than committing to a single forecast.
The base case is that current ceasefires hold, oil settles in the mid-$80s per barrel, US equities continue to grind higher on earnings, and reconstruction financing flows accelerate through 2027 as institutional frameworks mature. In this environment, the rotation toward real assets, defence, energy infrastructure, and selective EM exposure that began in Q1 continues. Reconstruction-themed instruments with credible structures outperform; those without underperform.
The upside case is durable peace across multiple theatres, faster Middle East supply normalisation, and a coordinated reconstruction effort that catalyses broader EM rebound. Oil drifts toward the $60s, inflation cools, and capital flows broaden into Ukrainian, Syrian, and Gaza reconstruction at pace. Even here, selectivity matters — the upside case rewards execution quality, not exposure quantity.
The downside case is renewed escalation, partial Strait reclosure, or a stalled peace process in Ukraine. Stagflation pressures intensify, equity markets correct further, and reconstruction capital pulls back as security conditions deteriorate. Gold, defence, and energy producers remain the clearest beneficiaries; broad EM and concentrated reconstruction bets are most exposed.
The direction of portfolio adjustment is similar across all three. The magnitude of the tilt differs, but the underlying logic — more real assets, more structurally-supported reconstruction exposure, less duration, more selectivity — does not.
The Deeper Point
Post-conflict environments concentrate the choices that matter in investment. Easy market exposure has already delivered its returns by the time the ceasefire is announced. From that point onward, returns come from selection within sectors, within geographies, and within structures, rather than from broad index exposure. This is true after every conflict in the historical record, and it is true now.
The investors who treat the post-conflict environment as "back to normal" tend to find their portfolios under-positioned for what comes next. The investors who treat it as a fundamentally different environment, with concentrated opportunities flanked by concentrated risks, are the ones whose capital compounds through the recovery rather than around it.
Reconstruction is not a one-quarter trade. It is a multi-decade capital deployment whose returns will accrue most heavily to those who structure their exposure carefully, stage their commitments, and respect the difference between a credible institutional vehicle and a thematic marketing exercise.
Book a consultation with our team to review how reconstruction and post-conflict allocation fit within your portfolio, and to assess specific opportunities against the criteria above.
***The information above is based on data from the IMF World Economic Outlook April 2026, World Bank Rapid Damage and Needs Assessment, European Commission, EBRD, and major institutional research desks current to May 2026. It is intended as analytical commentary and does not constitute personalised investment advice. Investors should consider their own circumstances, time horizons, and tax positions, ideally in consultation with an appropriately qualified advisor.